
Meiru Huo, Jiliang Qin, Yingrong Sun, Zhihui Yan, Xiaojun Jia. Generation of intensity difference squeezed state at a wavelength of 1.34 μm[J]. Chinese Optics Letters, 2018, 16(5): 052701
- Chinese Optics Letters
- Vol. 16, Issue 5, 052701 (2018)
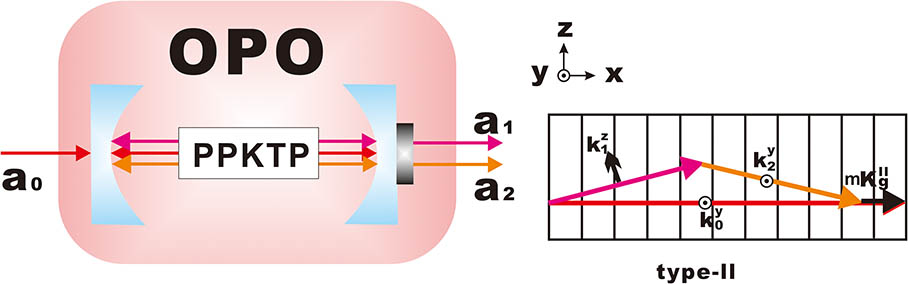
Fig. 1. Optical parametric conversation and QPM process of the pump, signal, and idler beams in the OPO. a j ( j = 0 , 1 , 2 ) k j y z y z K g I I m
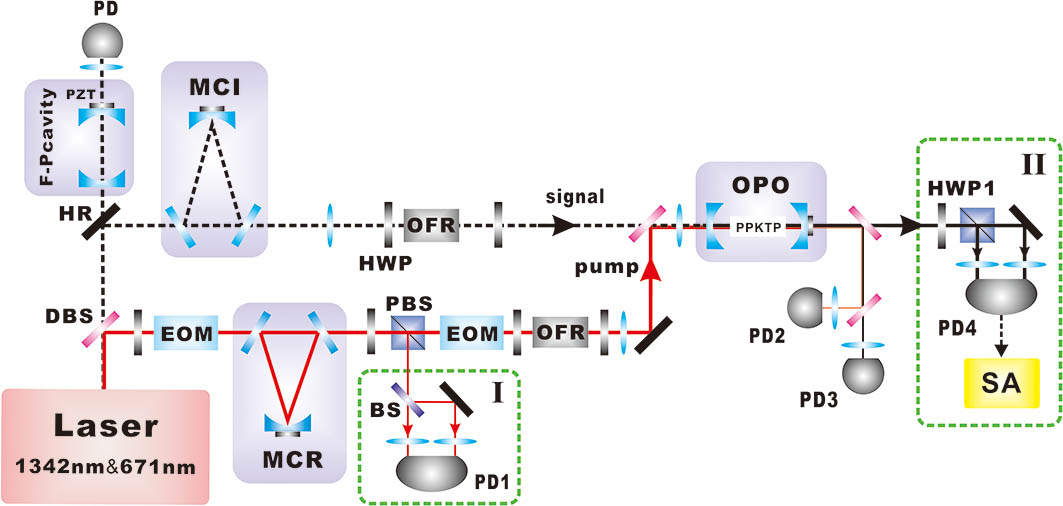
Fig. 2. Experimental schematic of generating the intensity difference squeezed state. Laser, Nd:YVO4/LBO; DBS, dichroic beam splitter; HR, mirror with reflectivity higher than 99.95%; EOM, electro-optical modulator; MCR (MCI), mode-cleaner for red beam (infrared beam); OFR, optical Faraday rotator; HWP, half-wave plate; PBS, polarization beam splitter; BS, 50:50 beam splitter; OPO, optical parametric oscillator; PD, photoelectric detector; PZT, piezoelectric ceramic; SA, spectrum analyzer.
Fig. 3. Measurement for noise of the red laser. The red curve is measured when two photodiodes of the homodyne detector (PD1) are injected with a red laser, and the blue curve is measured by blocking one photodiode of PD1.
Fig. 4. Noise power of the generated intensity difference squeezed state versus different analysis frequencies. The blue curve is the SNL, and the red curve is the noise of the intensity difference squeezed state.

Set citation alerts for the article
Please enter your email address
© Copyright 2018-2021 | Chinese Laser Press. All Rights Reserved 沪ICP备15018463号-20