• Chinese Optics Letters
  • Vol. 17, Issue 3, 031901 (2019)
Zixuan Song1、2, Xingyu Yue3, Yu Luo3, Haodong Li3, and Yanting Zhao1、2、*
Author Affiliations
  • 1State Key Laboratory of Quantum Optics and Quantum Optics Devices, Institute of Laser Spectroscopy, Shanxi University, Taiyuan 030006, China
  • 2Collaborative Innovation Center of Extreme Optics, Shanxi University, Taiyuan 030006, China
  • 3College of Physics and Electronics Engineering, Shanxi University, Taiyuan 030006, China
  • show less
    DOI: 10.3788/COL201917.031901 Cite this Article Set citation alerts
    Zixuan Song, Xingyu Yue, Yu Luo, Haodong Li, Yanting Zhao. Absorption saturation measurement using the tapered optical nanofiber in a hot cesium vapor[J]. Chinese Optics Letters, 2019, 17(3): 031901 Copy Citation Text show less
    A schematic of the experimental setup. The left side of the diagram is the optical system, and the right side is the TOF system. Photodiode detectors PD1 and PD2 are used to record the reference signal of the saturated absorption spectrum and the free-space beam respectively. The APD is used for the TOF signal. The image of the tapered nanofiber under the scanning electron microscope is also shown in the diagram. PD, photodiode; APD, avalanche photodiode; PBS, polarization beam splitter; BS, beam splitter; λ/2, half-wave plate.
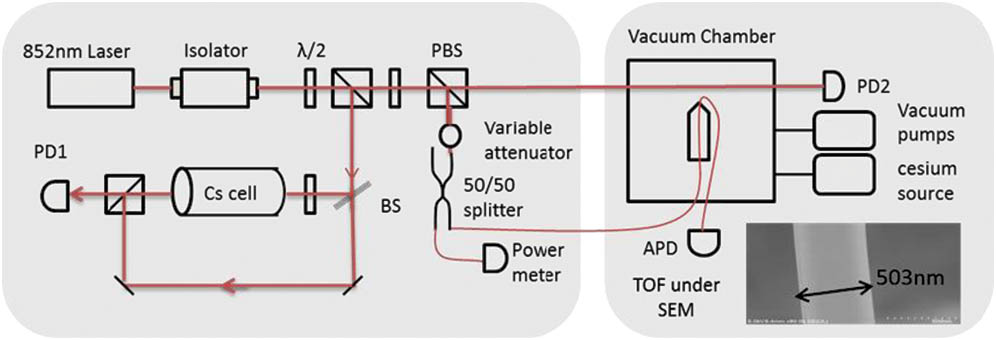
    Fig. 1. A schematic of the experimental setup. The left side of the diagram is the optical system, and the right side is the TOF system. Photodiode detectors PD1 and PD2 are used to record the reference signal of the saturated absorption spectrum and the free-space beam respectively. The APD is used for the TOF signal. The image of the tapered nanofiber under the scanning electron microscope is also shown in the diagram. PD, photodiode; APD, avalanche photodiode; PBS, polarization beam splitter; BS, beam splitter; λ/2, half-wave plate.
    Absorption signals of Cs D2 line for the TOF system (black) measured by the APD with the input power of 1 nW, and the vacuum chamber (red) measured by PD2 with the input power of 4.9 mW. The temperature of TOF is around 101°C. The Doppler-free saturated spectrum (blue) obtained by PD1 is used as a frequency reference.
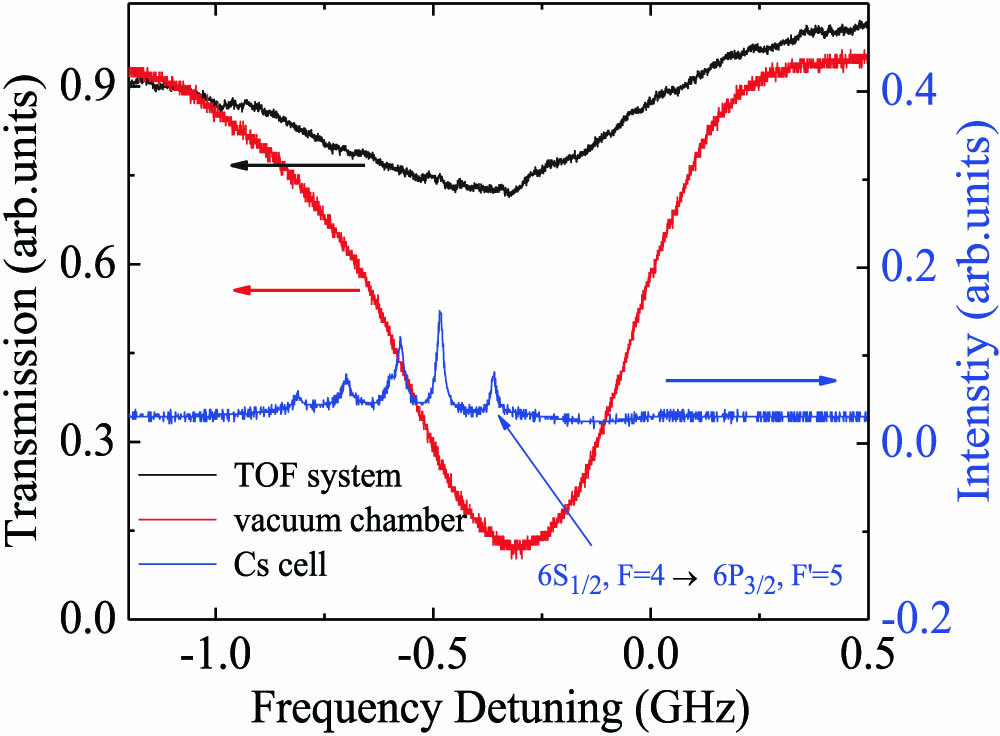
    Fig. 2. Absorption signals of Cs D2 line for the TOF system (black) measured by the APD with the input power of 1 nW, and the vacuum chamber (red) measured by PD2 with the input power of 4.9 mW. The temperature of TOF is around 101°C. The Doppler-free saturated spectrum (blue) obtained by PD1 is used as a frequency reference.
    Comparison of the measured transmission for (a) the TOF system and (b) free-space vapor under different temperatures.
    Fig. 3. Comparison of the measured transmission for (a) the TOF system and (b) free-space vapor under different temperatures.
    Measured transmission for the TOF system as a function of atomic density under different input powers.
    Fig. 4. Measured transmission for the TOF system as a function of atomic density under different input powers.
    Zixuan Song, Xingyu Yue, Yu Luo, Haodong Li, Yanting Zhao. Absorption saturation measurement using the tapered optical nanofiber in a hot cesium vapor[J]. Chinese Optics Letters, 2019, 17(3): 031901
    Download Citation