
Ling Feng, Wan-Ni Ji. Pricing of stochastic volatility stock index option based on Feynman path integral [J]. Acta Physica Sinica, 2019, 68(20): 203101-1
- Acta Physica Sinica
- Vol. 68, Issue 20, 203101-1 (2019)
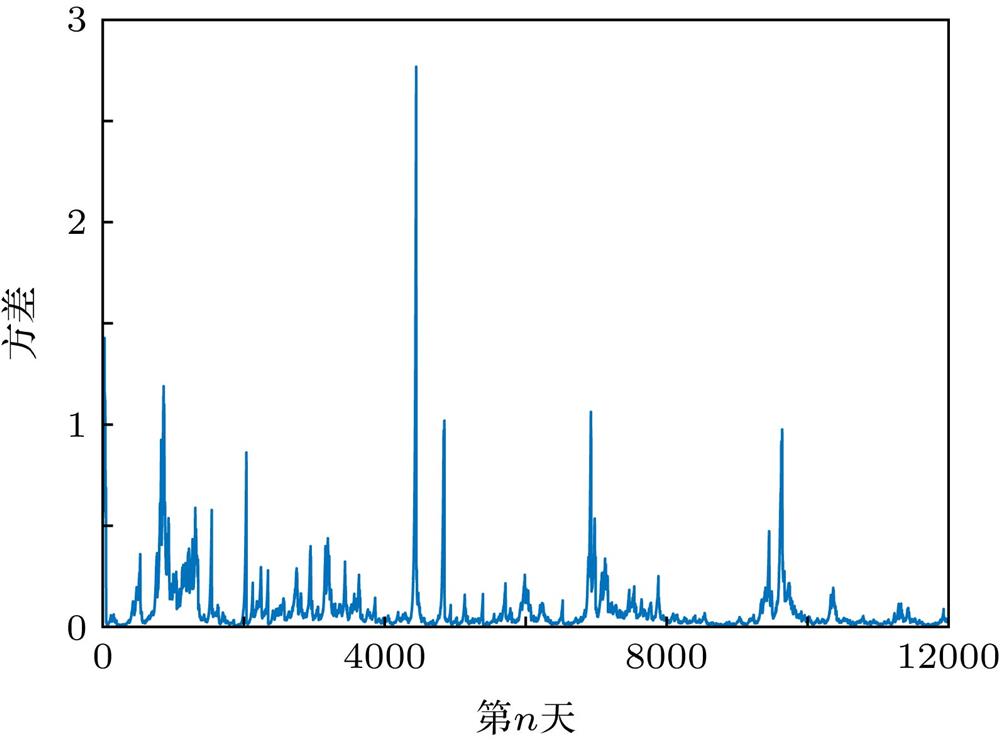
Fig. 1. Daily variance diagram from EWMA modelEWMA模型得到的日方差图
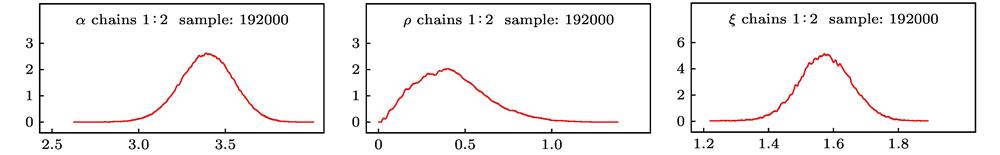
Fig. 2. Kernel density.核密度图
Fig. 3. Path diagram.路径图
Fig. 4. In-the-money option (K = 25200 as an example).
实值期权(以K = 25200为例)
Fig. 5. At-the-money option (K = 25800 as an example).
平值期权(K = 25800)
Fig. 6. Out-of-the-money option (K = 26400 as an example).
虚值期权(以K = 26400为例)
Fig. 7. A comparison of the two models with maturity date of February 2019到期日为2019年2月时两模型的平值期权价格对比图
Fig. 8. A comparison of the two models with maturity date of September 2019.到期日为2019年9月时两模型的平值期权价格对比图
Fig. 9. A comparison of the two models with maturity date of June 2019到期日为2019年6月时两模型的平值期权价格对比图
Fig. 10. RMSE for the two models on the same due date.相同到期日不同执行价格下两种模型的RMSE对比图
Fig. 11. Theil inequality coefficients for the two models on the same maturity date.相同到期日不同执行价格下两种模型的Theil不等系数对比图
| |||||||||||||||||||||||||||||||||||||||
Table 1.
Parameter estimates.
参数估计结果
| |||||||||||||||||||||||||||||||
Table 2.
K = 25800, the evaluation index values of the two models under different maturity dates.
K = 25800下两种模型不同到期日下的评价指标值

Set citation alerts for the article
Please enter your email address
© Copyright 2018-2021 | Chinese Laser Press. All Rights Reserved 沪ICP备15018463号-20