
Hao Zhang, Jie Zhao, Yanting Hu, Qianni Li, Yu Lu, Yue Cao, Debin Zou, Zhengming Sheng, Francesco Pegoraro, Paul McKenna, Fuqiu Shao, Tongpu Yu, "Efficient bright γ-ray vortex emission from a laser-illuminated light-fan-in-channel target," High Power Laser Sci. Eng. 9, 03000e43 (2021)
- High Power Laser Science and Engineering
- Vol. 9, Issue 3, 03000e43 (2021)
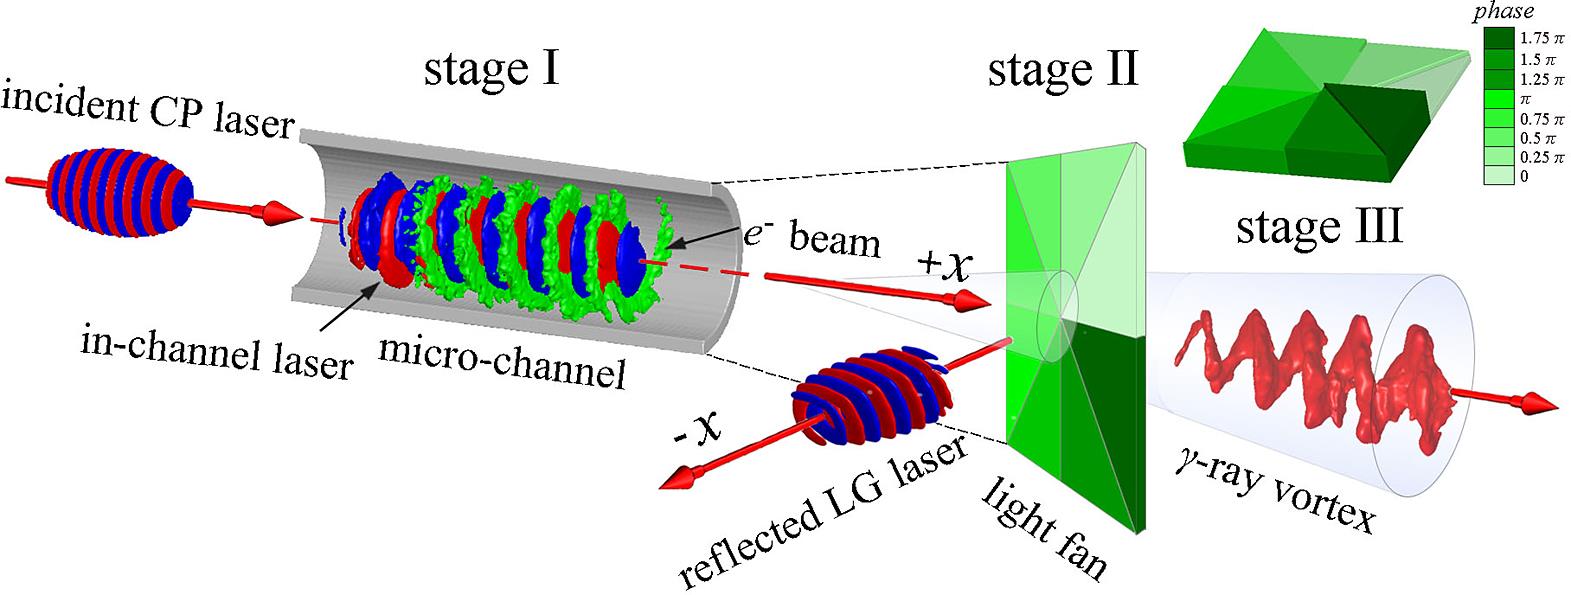
Fig. 1. Schematic of γ-ray vortex generation from a laser-illuminated light-fan-in-channel target. A CP laser pulse is incident from the left and irradiates a micro-channel target. Electrons are extracted from the channel wall, travel along the channel, and are accelerated to hundreds of MeV by the longitudinal electric fields. Later, the laser pulse is reflected along the – x axis by a light fan and an LG laser pulse is thus formed which collides head-on with the dense energetic electron beam with large AM. This finally results in the generation of a bright multi-MeV γ-ray vortex. Note that the fan-foil is perpendicular to the axis of the micro-channel and the arrow of reflected laser points to the micro-channel.
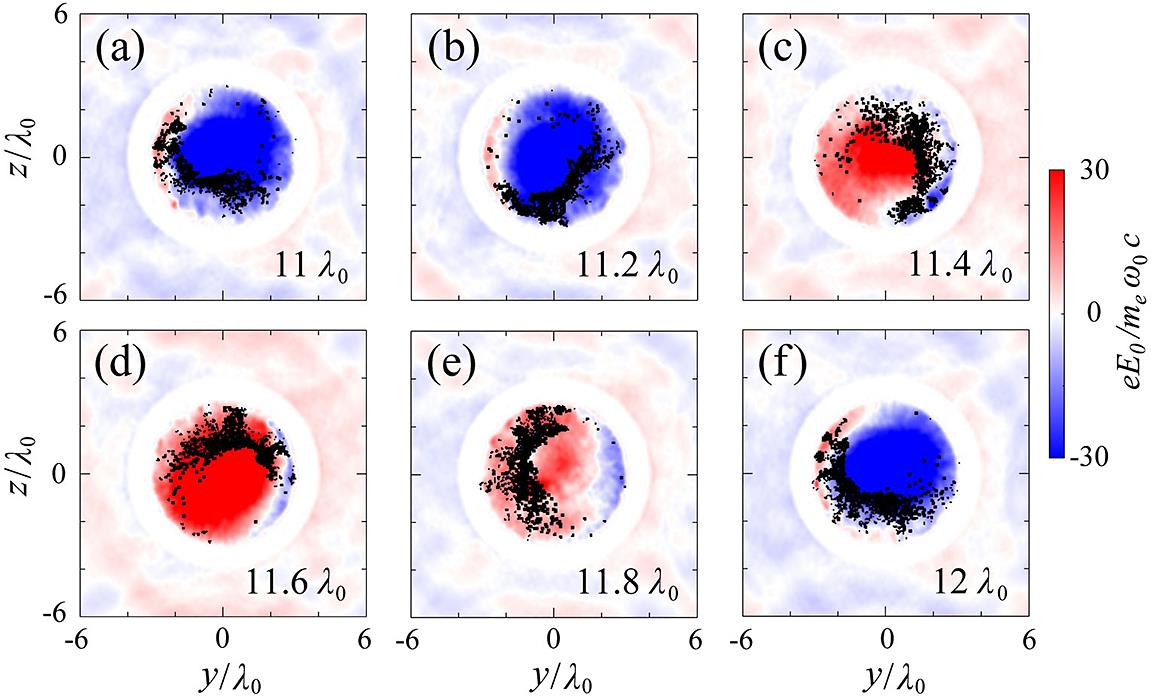
Fig. 2. Distributions of the transverse electric field Ey at different cross-sections from  to
to  at
at  . The black dots represent the positions of energetic electrons dragged out from the channel wall.
to at . The black dots represent the positions of energetic electrons dragged out from the channel wall. Fig. 3. (a) Three-dimensional isosurface distribution of electron energy density of 60 MeV at  . The (
y , z ) projection plane of electron energy density on the left is taken at  , the (
x , y ) projection plane at the bottom is taken at z = 0, and the (x , z ) projection plane at the rear is taken at y = 0. Distribution of the (b) longitudinal electric field Ex and (c) transverse electric field Ey at  and
and  . (d) Typical electron trajectories in the phase space (
 ). (e) Projection of some typical electron trajectories in the
 y –z plane until  . Here the colorbar represents the electron energy. (f) Electron momentum distribution in the
 y –z plane at  . Evolution of (g) electron beam divergence and (h) energy spectrum. The black dashed circles in (d)–(f) represent the boundaries of the micro-channel.
. The (, the ( and . (d) Typical electron trajectories in the phase space (). (e) Projection of some typical electron trajectories in the . Here the colorbar represents the electron energy. (f) Electron momentum distribution in the . Evolution of (g) electron beam divergence and (h) energy spectrum. The black dashed circles in (d)–(f) represent the boundaries of the micro-channel. Fig. 4. Distributions of the transverse electric field Ey at different cross-sections from  to
to  at
at  when the incident laser pulse is completely reflected by the light fan.
to at when the incident laser pulse is completely reflected by the light fan. Fig. 5. (a) Distributions of  along the
 x -axis at  and (b) three-dimensional isosurface distribution of photon number density of 10
 nc at  . The (
y , z ) projection plane on the left is taken at  , the (
x, y ) projection plane at the bottom is taken at  , and the (
x, y ) projection plane at the rear is taken at y = 0. (c)–(f) and (g)–(j) Transverse distributions of  and the photon number density at different cross-sections ranging from
  to
to  at
at  The black dashed circles in (c)–(j) represent the boundaries of the micro-channel.
along the and (b) three-dimensional isosurface distribution of photon number density of 10 . The (, the (, and the ( and the photon number density at different cross-sections ranging from to at The black dashed circles in (c)–(j) represent the boundaries of the micro-channel. Fig. 6. (a) Energy spectra of γ -photons at  ,
,  ,
,  , and
, and  . (b) Evolution of the
 γ -photon brilliance (black), instantaneous radiation power (red), photon number (blue), and total energy (green). Here the gray area marks the collision stage. (c) Divergence angle of γ -photons (top) at  ,
,  ,
,  , and
, and  . Here the bottom shows the angular-energy distribution of
  -photons at
  .
.
, , , and . (b) Evolution of the , , , and . Here the bottom shows the angular-energy distribution of -photons at . Fig. 7. (a) Evolution of BAM of electrons (black arrow), protons (blue arrow), carbon ions (green arrow), and  -photons (red arrow). (b) Evolution of laser energy conversion efficiency to electrons (black arrow), protons (blue arrow), carbon ions (green arrow), and
  -protons (red arrow). Here the gray area denotes the collision stage and the arrows indicate the
 y axes of different curves.
-photons (red arrow). (b) Evolution of laser energy conversion efficiency to electrons (black arrow), protons (blue arrow), carbon ions (green arrow), and -protons (red arrow). Here the gray area denotes the collision stage and the arrows indicate the Fig. 8. Evolution of (a) averaged AM of laser photons and (b) averaged BAM of  -photons in the right-handed helix fan case (RH fan, black), plane foil case (blue), and left-handed helix fan case (LF fan, red). The gray area shows the collision stage.
-photons in the right-handed helix fan case (RH fan, black), plane foil case (blue), and left-handed helix fan case (LF fan, red). The gray area shows the collision stage. Fig. 9. Scaling of the photon yield ( , black circles), the laser energy conversion efficiency (
 , red circles), and total
  -photon BAM (
 , blue circles) with (a) the laser electric field amplitude
  and (b) the micro-channel length
  . Here, the black and blue curves are the fitting results.
, black circles), the laser energy conversion efficiency (, red circles), and total -photon BAM (, blue circles) with (a) the laser electric field amplitude and (b) the micro-channel length . Here, the black and blue curves are the fitting results. 

Set citation alerts for the article
Please enter your email address

© Copyright 2018-2021 | Chinese Laser Press. All Rights Reserved 沪ICP备15018463号-20