• Acta Geographica Sinica
  • Vol. 75, Issue 9, 1948 (2020)
Zecheng GUO1, Wei WEI1、*, Peiji SHI1, Liang ZHOU2、3, Xufeng WANG4, Zhenya LI1, Sufei PANG1, and Binbin XIE5
Author Affiliations
  • 1College of Geography and Environmental Science, Northwest Normal University, Lanzhou 730070, China
  • 2Faculty of Geomatics, Lanzhou Jiaotong University, Lanzhou 730070, China
  • 3State Key Laboratory of Resources and Environmental Information System, Institute of Geographic Sciences and Natural Resources Research, CAS, Beijing 100101, China
  • 4Key Laboratory of Ecohydrology of In-land River Basin/Gansu Qilian Mountains Ecological Research Center, Northwest Institute of Eco-environment and Resources, CAS, Lanzhou 730000, China
  • 5School of Urban Economics and Tourism Culture, Lanzhou City University, Lanzhou 730070, China
  • show less
    DOI: 10.11821/dlxb202009010 Cite this Article
    Zecheng GUO, Wei WEI, Peiji SHI, Liang ZHOU, Xufeng WANG, Zhenya LI, Sufei PANG, Binbin XIE. Spatiotemporal changes of land desertification sensitivity in the arid region of Northwest China[J]. Acta Geographica Sinica, 2020, 75(9): 1948 Copy Citation Text show less
    Analysis of the principle of desertification sensitivity
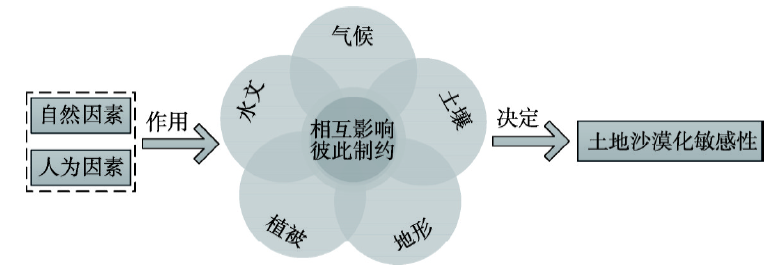
    Fig. 1. Analysis of the principle of desertification sensitivity
    Spatial distribution of background elements in the arid region of Northwest China in 2017
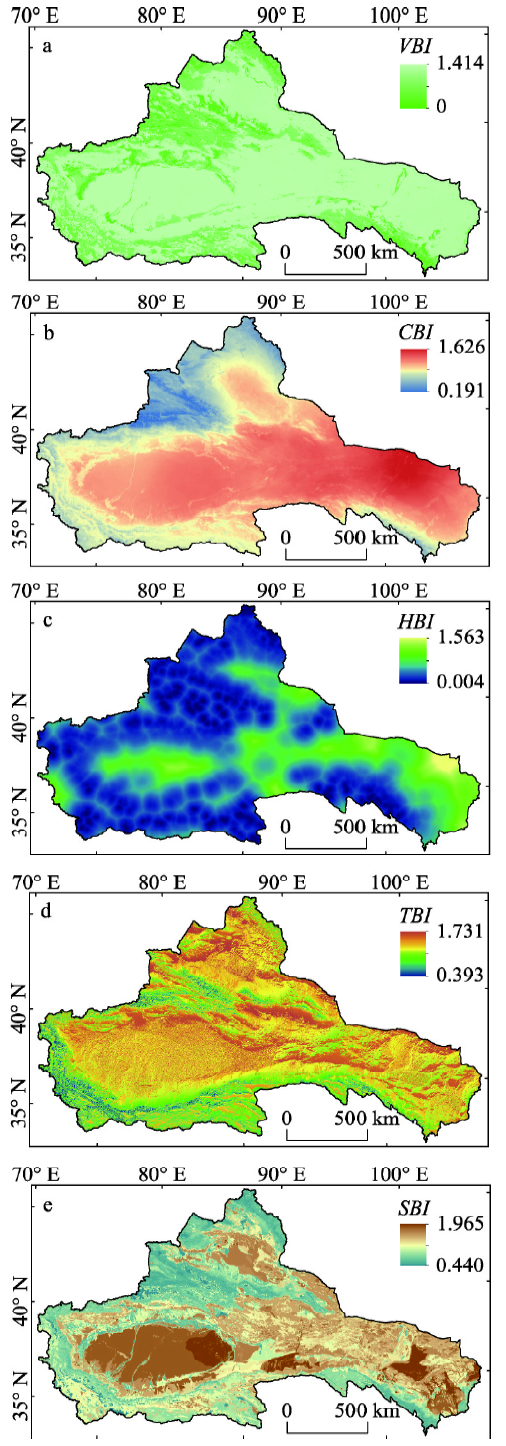
    Fig. 2. Spatial distribution of background elements in the arid region of Northwest China in 2017
    Spatial distribution of desertification sensitivity in the arid region of Northwest China
    Fig. 3. Spatial distribution of desertification sensitivity in the arid region of Northwest China
    Area statistics of desertification sensitivity in the arid region of Northwest China
    Fig. 4. Area statistics of desertification sensitivity in the arid region of Northwest China
    Spatial distribution of typical regions in the arid region of Northwest China
    Fig. 5. Spatial distribution of typical regions in the arid region of Northwest China
    Area statistics of different conversion types of desertification sensitivity in the arid region of Northwest China
    Fig. 6. Area statistics of different conversion types of desertification sensitivity in the arid region of Northwest China
    Spatial distribution of overall conversion types for desertification sensitivity in the arid region of Northwest China
    Fig. 7. Spatial distribution of overall conversion types for desertification sensitivity in the arid region of Northwest China
    Area statistics of overall transformation types for desertification sensitivity in the arid region of Northwest China
    Fig. 8. Area statistics of overall transformation types for desertification sensitivity in the arid region of Northwest China
    一级指标层二级指标层标准化处理
    地形本底指数海拔-
    坡度-
    坡向+
    土壤本底指数土壤有机质含量-
    土壤侵蚀强度+
    土壤深度+
    土壤含砂量+
    水文本底指数距冰川雪地距离+
    距主要河流距离+
    距湖泊水库距离+
    气候本底指数干燥度-
    地表温度+
    平均风速+
    植被本底指数NDVI-
    植被抗旱能力+
    Table 1. Evaluation index system of desertification sensitivity
    单一本底指数计算公式解释说明
    地形本底指数TBI=E-Elow2+S-Slow2+A-Alow2式中:ESA分别为海拔、坡度和坡向因子;ElowSlowAlow分别为由海拔、坡度和坡向构成的三维空间中代表的在这3个维度上敏感性程度最低值,下同;基准点(Elow, Slow, Alow)为(0, 0, 0),TBI值越大,代表在地形这个因子层面上土地沙漠化敏感性越高。其中海拔是基于数字高程模型(DEM)直接获取,坡度和坡向则是借助ArcGIS 10.2中Slope和Aspect工具进行提取。坡向按敏感性由低到高排序为:平地<西、西北和北<东北和东<东南、南和西南,分别赋值为1~4[22]
    土壤本底指数SBI=SOMC-SOMClow2+SEI-SEIlow2+SSC-SSClow2+SD-SDlow2式中:SOMCSEISSCSD分别为土壤有机质含量、土壤侵蚀强度、土壤含砂量和土壤深度;基准点(SOMClow, SEIlow, SSClow, SDlow)为(0, 0, 0, 0),SBI值越大,其土壤基底条件越差,土地沙漠化敏感性程度就越高。其中土壤有机质含量是根据世界土壤数据库中的土壤有机碳除以0.58换算得来;土壤侵蚀强度根据微度侵蚀、轻度侵蚀、中度侵蚀、强度侵蚀、极强度侵蚀和剧烈侵蚀6种侵蚀类型等级,分别赋值为1~6;土壤含砂量由中国科学院资源与环境科学数据中心提供;土壤深度则根据土壤类型定量化而来[18, 22]
    水文本底指数HBI=DS-DSlow2+DR-DRlow2+DLR-DLRlow2式中:DSDRDLR分别为距冰川雪地距离、距主要河流距离和距湖泊水库距离;基准点(DSlow, DRlow, DLRlow)为(0, 0, 0),HBI值越大,代表区域水资源量越低,其土地沙漠化沙漠化敏感性就越高。其中距冰川雪地、主要河流和湖泊水库的距离是借助ArcGIS 10.2中Euclidean distance工具[20, 31]进行计算得来的。
    气候本底指数AI=Pt0+10式中:AIPt 0分别为干燥度、年平均降水量和年平均气温;AWVLST分别为平均风速和地表温度;基准点(AWVlow, AIlow, LSTlow)为(0, 0, 0),CBI值越大,代表着气候条件越恶劣,土地沙漠化敏感性越高。其中,地表温度为MODIS数据产品,干燥度和平均风速利用研究区及周边112个气象站点提供各年份的站点数据,并采用克里金插值法(Kriging)插值得到空间分布图[20]。平均风速可由气象数据集中直接获取,而本研究则采用de Martonne方法计算干燥度,其计算过程简单,数据容易获取,且经过实际应用后发现,在中国西北地区有较好的利用价值[21]
    CBI=AWV-AWVlow2+AI-AIlow2+LST-LSTlow2
    植被本底指数VBI=NDVI-NDVIlow2+DR-DRlow2式中:NDVIDR为归一化植被指数和植被抗旱能力;基准点(NDVIlow, DRlow)为(0, 0),VBI值越大,代表植被覆盖越低,沙漠化敏感性越高。其中归一化植被指数来源于MODIS数据产品,而植被抗旱能力是根据植被类型定量化提取,按沙漠化敏感性由低到高排序为:阔叶林、针叶林、针阔叶混交林和水域<沼泽、栽培植被、高山植被和灌丛<草原、草甸、牧场和草丛<荒漠、岩石和无植被覆盖区,分别赋值为1~4[22]
    Table 2. Construction methods of each background index
    类别值敏感性值域
    1不敏感< 1.561
    2轻度敏感1.561~1.842
    3中度敏感1.842~2.131
    4高度敏感2.131~2.386
    5极度敏感≥ 2.386
    Table 3. Classification standard for desertification sensitivity
    转换类型代码赋值说明
    稳定型111112000—2017年,敏感类型未发生变化
    增加型0001, 0111, 001122000—2017年,敏感类型由其他类型转化而增加
    减少型1000, 1100, 111032000—2017年,敏感类型逆转为其他类型而减少
    波动稳定型0010, 0100, 0110, 1001, 1011, 110142017年相对于2000年敏感类型未发生变化,在2005和2010年呈波动性变化
    波动增加型010152017年相对于2000年该敏感类型有所增加,在2005和2010年呈波动性变化
    波动减少型101062017年相对于2000年该敏感类型有所减少,在2005和2010年呈波动性变化
    其他00000其他沙漠化敏感类型
    Table 4. Classification of each sensitivity conversion type
    赋值代码含义
    100001敏感性类型一直为极度敏感
    200010敏感性类型一直为高度敏感
    300023, 00056敏感性类型由极度敏感转化为高度敏感
    400044敏感性类型在极度敏感和高度敏感间波动转换
    500032, 00065敏感性类型由高度敏感逆转为极度敏感
    600100敏感性类型一直为中度敏感
    700230, 00560敏感性类型由高度敏感转化为中度敏感
    800440敏感性类型在高度敏感和中度敏感间波动转换
    900320, 00650敏感性类型由中度敏感逆转为高度敏感
    1001000敏感性类型一直为轻度敏感
    1102300, 05600敏感性类型由中度敏感转化为轻度敏感
    1204400敏感性类型在中度敏感和轻度敏感间波动转换
    1303200, 06500敏感性类型由轻度敏感逆转为中度敏感
    1410000敏感性类型一直为不敏感
    1523000, 56000敏感性类型由轻度敏感转化为不敏感
    1644000敏感性类型在轻度敏感和不敏感间波动转换
    1732000, 65000敏感性类型由不敏感逆转为轻度敏感
    Table 5. Classification of overall conversion types of desertification sensitivity
    本底指数2000年2005年2010年2017年
    qpqpqpqp
    土壤本底指数0.7140.000***0.7100.000***0.7120.000***0.7150.000***
    地形本底指数0.3110.000***0.3220.000***0.3080.000***0.3010.000***
    气候本底指数0.7040.000***0.7100.000***0.7100.000***0.7110.000***
    水文本底指数0.4350.000***0.4310.000***0.4330.000***0.4170.000***
    植被本底指数0.6120.000***0.6100.000***0.6080.000***0.6090.000***
    Table 6. Geographical detector results of natural factors
    沙漠化敏感性指数2000年2005年2010年2017年
    rprprprp
    人口密度-0.1050.270-0.1070.261-0.1110.243-0.0890.350
    人均GDP0.1350.1550.2170.021**0.3230.001**0.3340.000***
    Table 7. Correlation analysis of socio-economic factors and desertification sensitivity index
    Zecheng GUO, Wei WEI, Peiji SHI, Liang ZHOU, Xufeng WANG, Zhenya LI, Sufei PANG, Binbin XIE. Spatiotemporal changes of land desertification sensitivity in the arid region of Northwest China[J]. Acta Geographica Sinica, 2020, 75(9): 1948
    Download Citation