
Xue-Li Ding, Bing Jia, Yu-Ye Li. Explanation to negative feedback induced-enhancement of neural electronic activities with phase response curve [J]. Acta Physica Sinica, 2019, 68(18): 180502-1
- Acta Physica Sinica
- Vol. 68, Issue 18, 180502-1 (2019)
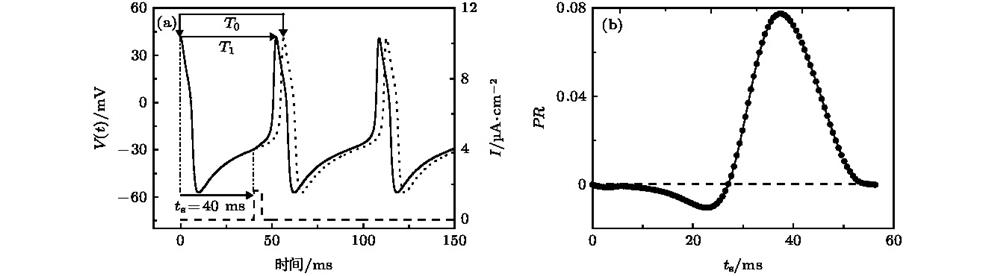
Fig. 1. Spiketrains and PRC of the ML model when I = 45.5 µA·cm–2, A = 1.65 µA·cm–2, and d = 4.4 ms: (a) Square pulse disturbance current (dashed line), and spike trains without (dotted line) and with square pulse disturbance (solid line); (b) PRC.
当I = 45.5 µA·cm–2, 方波脉冲幅值A = 1.65 µA·cm–2, 宽度d = 4.4 ms时, ML模型的放电序列和PRC (a) 方波脉冲刺激电流(短划线)、没有方波脉冲的放电(点线)和有方波脉冲的放电(实线); (b) PRC
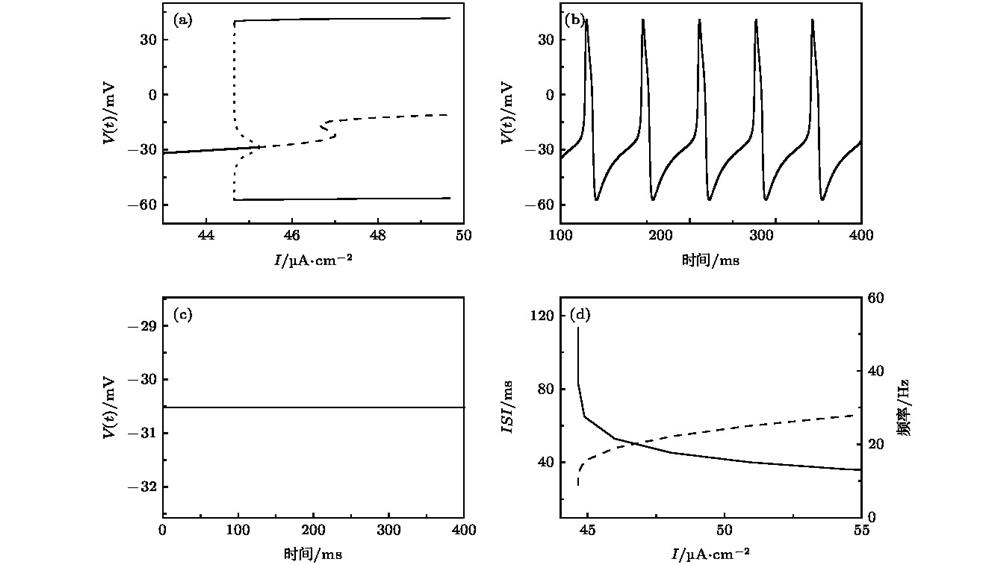
Fig. 2. (a) Bifurcation of ML model with respect to I ; (b) spike trains of ML model when I = 45.5 µA·cm–2; (c) resting state of ML model when I = 44 µA·cm–2; (d) the changes of ISI s (solid line) and frequency (dashed line) with respect to I .
(a) ML模型随I 的平衡点分岔; (b) 当I = 45.5 µA·cm–2时, ML模型的放电序列图; (c) 当I = 44 µA·cm–2时, ML模型处于静息状态; (d) ISIs 和频率随I 的变化(实线表示ISIs , 虚线表示频率)
Fig. 3. Spike trains induced by square pulse current applied at different phases when I = 45.5 µA·cm–2. The spike trains (solid line) influenced by negative square pulse current (dashed line) and the trains (red dotted line) without negative square pulse current. (a) t s = 22 ms, A = –0.6 µA·cm –2, d = 4.9 ms; (b) t s = 22 ms, A = –1.65 µA·cm –2, d = 4.8 ms; (c) t s = 40 ms, A = –0.6 µA·cm –2, d = 4.9 ms; (d) t s = 40 ms, A = –1.65 µA·cm –2, d = 4.8 ms.
当I = 45.5 µA·cm–2时, 负向方波脉冲电流(虚线)作用在不同相位的放电序列(实线)和无方波脉冲作用的放电序列(红色的点线) (a) t s = 22 ms, A = –0.6 µA·cm –2, d = 4.9 ms; (b) t s = 22 ms, A = –1.65 µA·cm –2, d = 4.8 ms; (c) t s = 40 ms, A = –0.6 µA·cm –2, d = 4.9 ms; (d) t s = 40 ms, A = –1.65 µA·cm –2, d = 4.8 ms
Fig. 4. PRC induced by negative square pulse current near the Hopf bifurcation point in the ML model when I = 45.5 µA·cm–2: (a) A = –0.6 µA·cm –2, d = 4.9 ms; (b) A = –1.65 µA·cm –2, d = 4.8 ms.
当I = 45.5 µA·cm–2时, ML模型在Hopf分岔点附近的负向脉冲刺激诱发的PRC (a) A = –0.6 µA·cm –2, d = 4.9 ms; (b) A = –1.65 µA·cm –2, d = 4.8 ms
Fig. 5. Inhibitory autapse current (dashed line) and spike trains (solid line) of the ML model with inhibitory autapse when I = 45.5 µA·cm–2 and g aut = 0.04 mS·cm–2: (a) τ = 0 mS; (b) τ = 10 mS; (c) τ = 20 mS; (d) τ = 30 mS; (e) τ = 40 mS; (f) τ =50 mS.
当I = 45.5 µA·cm–2, g aut = 0.04 mS·cm–2, 具有抑制性自突触ML模型的放电模式(实线)与抑制性自突触电流(短划线) (a) τ = 0 mS; (b) τ = 10 mS; (c) τ =20 mS; (d) τ = 30 mS; (e) τ = 40 mS; (f) τ =50 mS
Fig. 6. Change of normalized ISIs (boldsolid line) and firing frequency (thin solid line) with respect to time delay τ : (a) g aut = 0.01 mS·cm–2; (b) g aut = 0.04 mS·cm–2.
不同耦合强度g aut下归一化的ISIs (粗实线)和放电频率(细实线)随时滞τ 的变化 (a) g aut = 0.01 mS·cm–2; (b) g aut = 0.04 mS·cm–2
Fig. 7. Dependence of average ISIs on time delay τ and coupling strength g aut when D = 0.5 µA·cm–2.
当噪声强度D = 0.5 µA·cm–2时, 平均ISIs 对时滞τ 和耦合强度g aut的依赖关系
Fig. 8. (a) Dependence of standard deviation of ISIs (STD ) on time delay τ and coupling strength g aut; (b) the dependence of coefficient of variation of ISIs (CV ) on delay τ and coupling strength g aut. The parameter values are I = 45.5 µA·cm–2 and D = 0.5 µA·cm–2.
当I = 45.5 µA·cm–2, D = 0.5 µA·cm–2时, (a) ISIs 的STD 对时滞τ 和耦合强度g aut的依赖关系, (b) ISIs 的CV 对时滞τ 和耦合强度g aut的依赖关系
Fig. 9. Changes of coefficient of variation (CV ) of ISIs with respect to coupling strength g aut when time delay τ is fixed at different values: (a) τ = 27 ms; (b) τ = 30 ms; (c) τ = 40 ms; (d) τ = 46 ms.
固定时滞τ 在不同水平下, ISIs 的CV 随着耦合强度g aut的变化 (a) τ = 27 ms; (b) τ = 30 ms; (c) τ = 40 ms; (d) τ = 46 ms
Fig. 10. Changes of coefficient of variation (CV ) of ISIs with respect to time delay τ when coupling strength g aut is fixed at different levels: (a) g aut = 0.31 mS·cm–2; (b) g aut = 0.61 mS·cm–2.
固定耦合强度g aut在不同水平下, ISIs 的变异系数CV 随着时滞τ 的变化 (a) g aut = 0.31 mS·cm–2; (b) g aut = 0.61 mS·cm–2
Fig. 11. Effect of time delay τ on spike-timing precision of neuron model when I = 45.5 µA·cm–2, D = 0.5 µA·cm–2, and g aut = 0.61 mS·cm–2: (a) τ = 1 ms; (b) τ = 10 ms; (c) τ = 30 ms; (d) τ = 50 ms.
当I = 45.5 µA·cm–2, D = 0.5 µA·cm–2, 耦合强度g aut = 0.61 mS·cm–2时, 时滞τ 对神经元模型的精确放电的影响 (a) τ = 1 ms; (b) τ = 10 ms; (c) τ = 30 ms; (d) τ = 50 ms

Set citation alerts for the article
Please enter your email address
© Copyright 2018-2021 | Chinese Laser Press. All Rights Reserved 沪ICP备15018463号-20