• Chinese Journal of Lasers
  • Vol. 48, Issue 11, 1111001 (2021)
Mingxing Li1、2, Zhenyu Xu1、*, Ruifeng Kan1、**, Yabai He1, Lu Yao1, Bing Chen1, Jun Ruan1, Bangyi Tao3, and Hao Liu4
Author Affiliations
  • 1Anhui Institute of Optics and Fine Mechanics, Hefei Institutes of Physical Sciences, Chinese Academy of Sciences, Hefei, Anhui 230031, China
  • 2University of Science and Technology of China, Hefei, Anhui 230026, China
  • 3State Key Laboratory of Satellite Ocean Environment Dynamics, Second Institute of Oceanography, Ministry of Natural Resources, Hangzhou, Zhejiang 310012, China
  • 4College of Physics and Electronic Information, Anhui Normal University, Wuhu, Anhui 241000, China
  • show less
    DOI: 10.3788/CJL202148.1111001 Cite this Article Set citation alerts
    Mingxing Li, Zhenyu Xu, Ruifeng Kan, Yabai He, Lu Yao, Bing Chen, Jun Ruan, Bangyi Tao, Hao Liu. Development of Laser Gas Analyzer for Eddy Correlation Method[J]. Chinese Journal of Lasers, 2021, 48(11): 1111001 Copy Citation Text show less
    Simulated absorption spectra. (a) Absorption spectrum of H2O around 7181 cm-1; (b) absorption spectra of CO2 around 4990 cm-1
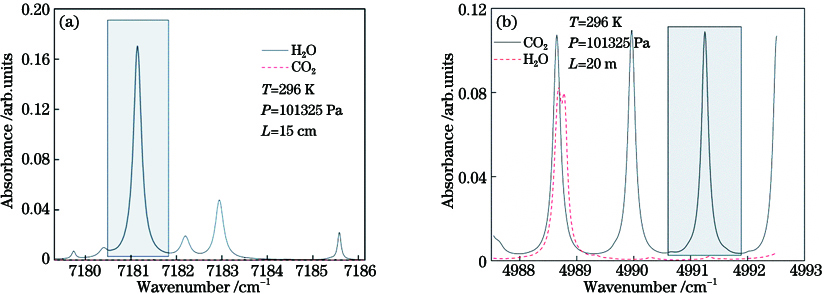
    Fig. 1. Simulated absorption spectra. (a) Absorption spectrum of H2O around 7181 cm-1; (b) absorption spectra of CO2 around 4990 cm-1
    Structural schematics of analyzers. (a) Structural schematic of H2O analyzer; (b) structural schematic of CO2 analyzer
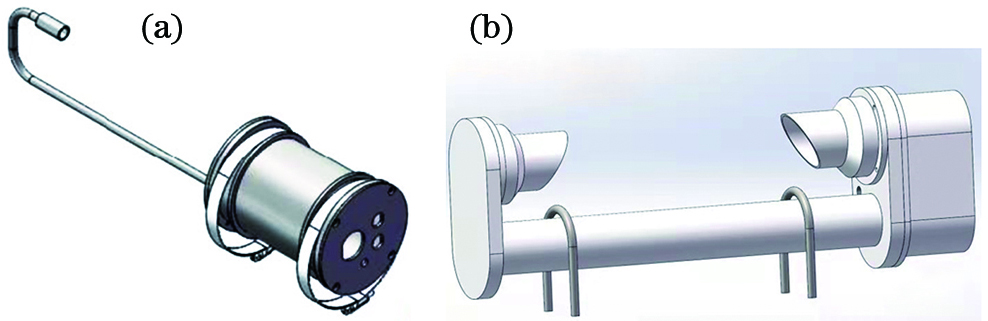
    Fig. 2. Structural schematics of analyzers. (a) Structural schematic of H2O analyzer; (b) structural schematic of CO2 analyzer
    Schematic and photo of measurement system. (a) Schematic of measurement system; (b) photo of measurement system
    Fig. 3. Schematic and photo of measurement system. (a) Schematic of measurement system; (b) photo of measurement system
    Spectral signals of different concentrations of CO2. (a) Direct absorption signal; (b) second derivative spectral signal
    Fig. 4. Spectral signals of different concentrations of CO2. (a) Direct absorption signal; (b) second derivative spectral signal
    Linear correlation between concentrations and peak values
    Fig. 5. Linear correlation between concentrations and peak values
    Instrument installation photos
    Fig. 6. Instrument installation photos
    Comparisons for continuous 4 h data and 1 s data. (a) H2O concentration data; (b) CO2 concentration data
    Fig. 7. Comparisons for continuous 4 h data and 1 s data. (a) H2O concentration data; (b) CO2 concentration data
    Allan variance analysis of TDLAS-CO2/H2O analyzers. (a) TDLAS-CO2 analyzer; (b) TDLAS-H2O analyzer
    Fig. 8. Allan variance analysis of TDLAS-CO2/H2O analyzers. (a) TDLAS-CO2 analyzer; (b) TDLAS-H2O analyzer
    Monitoring data for a continuous week of TDLAS-H2O/CO2 analyzer. (a) TDLAS-CO2 analyzer; (b) TDLAS-H2O analyzer
    Fig. 9. Monitoring data for a continuous week of TDLAS-H2O/CO2 analyzer. (a) TDLAS-CO2 analyzer; (b) TDLAS-H2O analyzer
    PerformanceTDLAS-H2O/CO2 analyzerLICOR7500-H2O/CO2 analyzer
    Detection limitH2O: 3.25×10⁻⁶@10 HzH2O: 4.70×10⁻⁶ @10 Hz
    8.17×10⁻⁶ @100 Hz6.70×10-6@20 Hz
    CO2: 0.13×10⁻⁶ @10 HzCO2: 0.11×10⁻⁶@10 Hz
    0.40×10⁻⁶ @100 Hz0.16×10-6@20 Hz
    Max time resolution /Hz10020
    Power consumption(normal operation) /W24
    Table 1. Main performances comparison of two instruments
    Mingxing Li, Zhenyu Xu, Ruifeng Kan, Yabai He, Lu Yao, Bing Chen, Jun Ruan, Bangyi Tao, Hao Liu. Development of Laser Gas Analyzer for Eddy Correlation Method[J]. Chinese Journal of Lasers, 2021, 48(11): 1111001
    Download Citation