
Nie Wei, Kan Ruifeng, Yang Chenguang, Chen Bing, Xu Zhenyu, Liu Wenqing. Research Progress on the Application of Tunable Diode Laser Absorption Spectroscopy[J]. Chinese Journal of Lasers, 2018, 45(9): 911001
- Chinese Journal of Lasers
- Vol. 45, Issue 9, 911001 (2018)
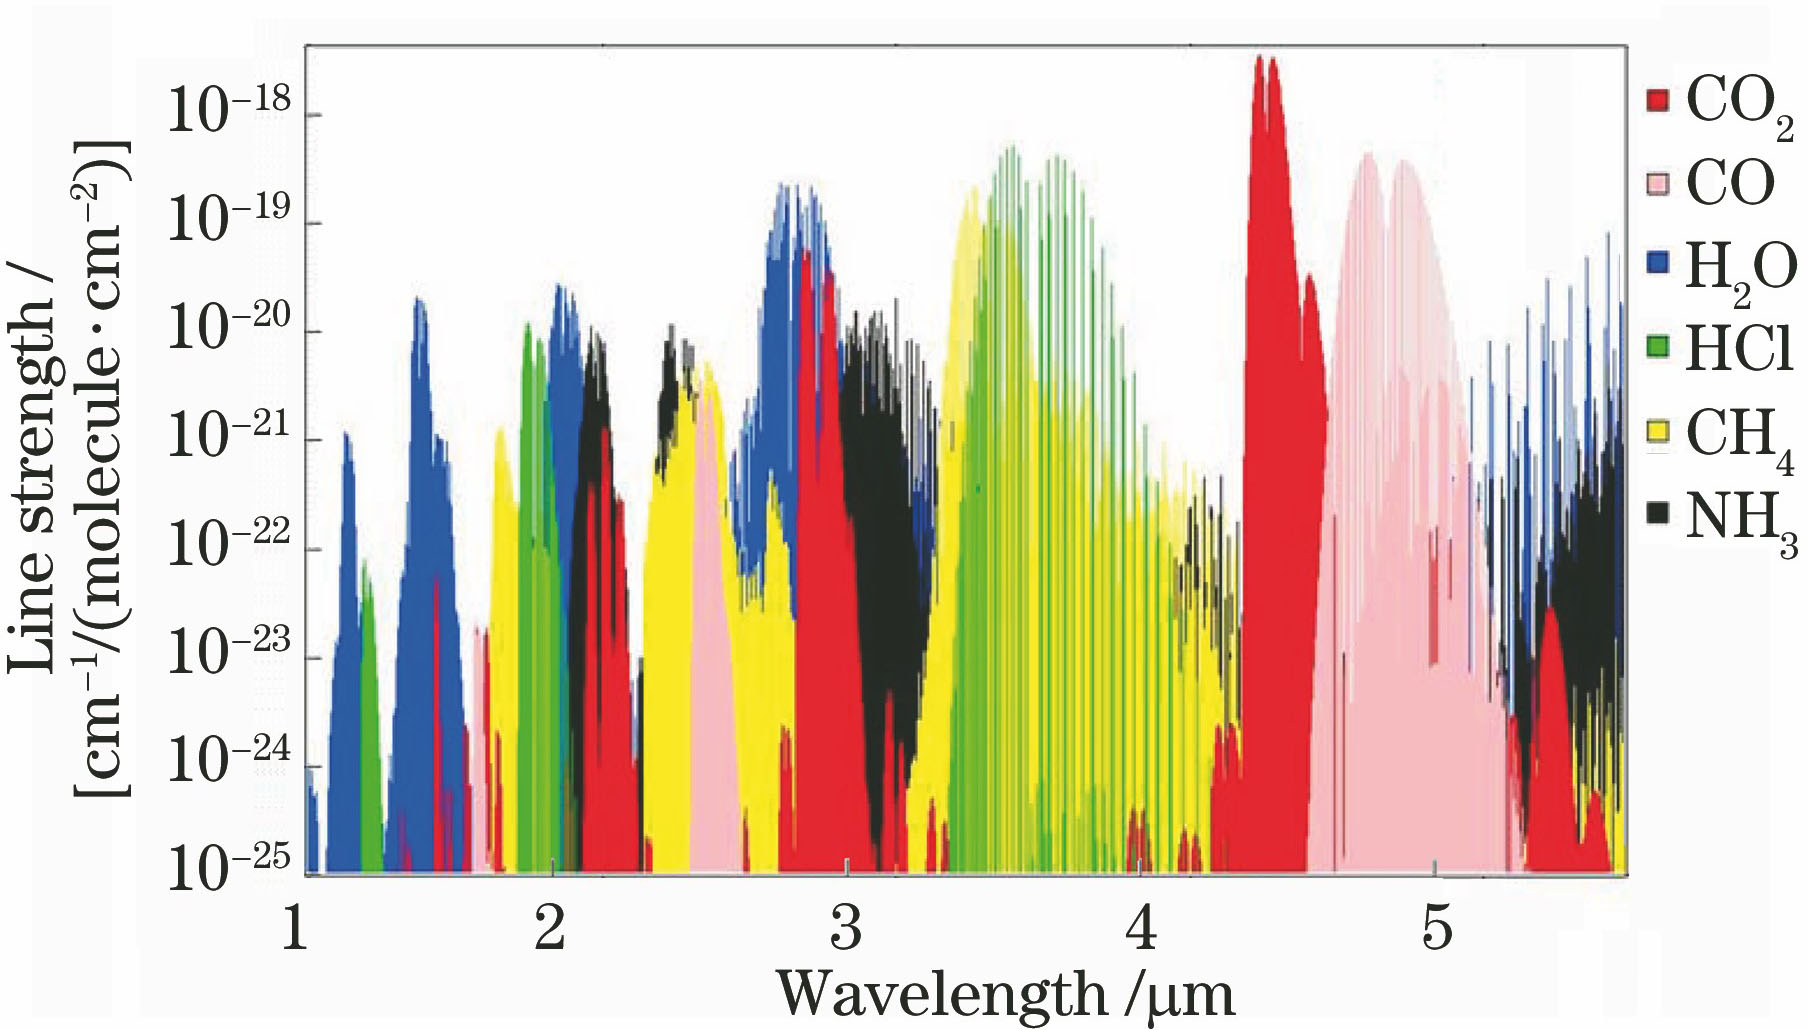
Fig. 1. Absorption spectra of several gas molecules, data from spectroscopic database HITRAN
![(a) Device diagram for atmospheric gas sensing based on wavelength modulation spectroscopy technique and the results of continuous online monitoring of (b) NO2, (c) NH3 and (d) NO[115]](/richHtml/zgjg/2018/45/9/0911001/img_2.jpg)
Fig. 2. (a) Device diagram for atmospheric gas sensing based on wavelength modulation spectroscopy technique and the results of continuous online monitoring of (b) NO2, (c) NH3 and (d) NO[115]
Fig. 3. (a) Schematic diagram of the online total emission measurement experimental setup and the continuous measurement results of (b) oxygen concentration and (c) oxygen flow rate[141]
Fig. 4. (a) Schematic configuration of a TDLAS system and (b) measurement of 15NO and 14NO concentration[152]
Fig. 5. (a) Schematic of instrument layout and methane carbon stable isotopic composition (δ13CCH4) measured via the in situ ICOS analyzer and (b) a conventional isotope ratio mass spectrometry (IRMS)[159]
Fig. 6. (a) Measuring device and (b)-(d) results of hypersonic combustion heating wind tunnel[180]
Fig. 7. Reconstructed distribution results. (a) Temperature; (b) water vapour concentration (volume fraction) [181]
Fig. 8. Absorption spectra of ordinary water (full lines, H area) and heavy water (dotted line, D area) at three selected temperatures[190]
Fig. 9. (a) Experimental setup and time-resolved measurement of film thickness and (b) temperature during film evaporation by TDLAS[186]
| |||||||||||||||||||||||||||||||||||||||||||||||||||||||||||||||||||||||||||||||||||||||||||||||||||||||||||||||||||||||||||||||
Table 1. Typical concentration detection limits in TDLAS technology[88]
|
Table 2. Physiological symptoms corresponding to their breath biomarker and typical laser wavelengths for TDLAS

Set citation alerts for the article
Please enter your email address
© Copyright 2018-2021 | Chinese Laser Press. All Rights Reserved 沪ICP备15018463号-20