
Lu Gao, Shixian Zhai, Han Sun, Tongsheng Chen. Automatic QuanTi-FRET Method for Measuring System Correction Factors Based on Single Imaging[J]. Chinese Journal of Lasers, 2022, 49(5): 0507203
- Chinese Journal of Lasers
- Vol. 49, Issue 5, 0507203 (2022)
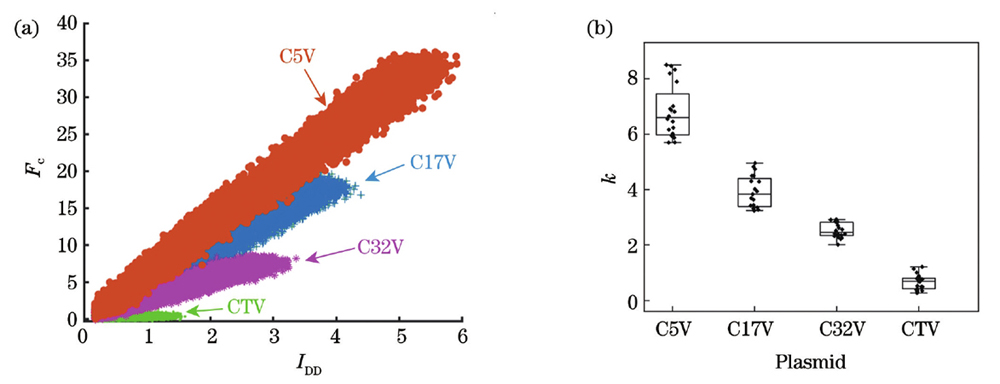
Fig. 1. Determining the k value range of four kinds of standard FRET plasmids. (a) Fc-IDDtwo-dimensional scatter diagram of four kinds of standard FRET plasmids. In the figure, the symbols“●”,“+”,“*”,and“˙”represent plasmids C5V, C17V, C32V, and CTV. The MCF7 cells transfected with the above four plasmids are cultured in four different culture dishes. (b) The k value range boxplot of four kinds of standard FRET plasmids. The range of k value of each plasmid is calculated from 80 cells transfected with the same plasmid in multiple culture dishes
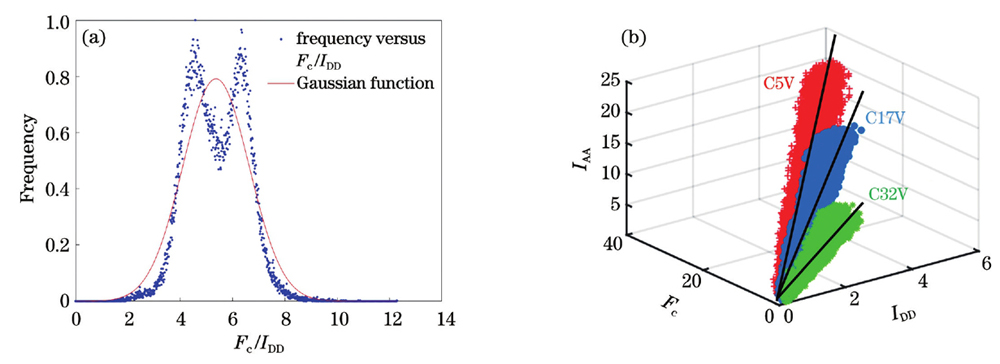
Fig. 2. Determining the standard lines of three kinds of FRET standard plasmids. (a) Pixel by pixel Fc/IDD spectrum diagram of fluorescence images of two adjacent cells, and the single peak Gaussian fitting degree in this region is 0.82; (b) standard lines of three kinds of FRET standard plasmids (in the figure, the black solid lines represent fitted standard line. Different kinds of plasmids are represented by different shapes of symbols: the symbol“+”,“●”,and“*”represent plasmids C5V, C17V, and C32V)
Fig. 3. Classification of multiple plasmid cells in one culture dish. (a) Classification result of multiple plasmid cells in one culture dish. Using AutoQT-FRET method to classify this visual field,we can find that there are three kinds of cells transfected with different FRET standard plasmids. Red, blue, and green cells show that plasmids C5V, C17V, and C32V were transfected, respectively. (b) Classification result of overlapping cells in Fig.3 (a)
Fig. 4. Statistical results obtained using different methods to measure system correction factor G. TP-G-1, TP-G-2, and TP-G-3 represent the methods of measuring correction factor G with C5V and CTV plasmids, C17V and CTV plasmids, and C32V and CTV plasmids, respectively
|
Table 1. Slope k value range of different standard FRET plasmids

Set citation alerts for the article
Please enter your email address
© Copyright 2018-2021 | Chinese Laser Press. All Rights Reserved 沪ICP备15018463号-20