• High Power Laser and Particle Beams
  • Vol. 32, Issue 2, 025010 (2020)
Congying Qiu1、1, Xiantao Guan1、1, Zhen Liu1、1、*, Anna Zhu2、2, and Keping Yan1、1
Author Affiliations
  • 1Institute of Industrial Ecology and Environment, Zhejiang University, Hangzhou 310028, China
  • 2Research Institute of Chemical Defense, Academy of Military Science PLA China, State Key Laboratory of NBC Protection for Civilian, Beijing 102205, China
  • show less
    DOI: 10.11884/HPLPB202032.190390 Cite this Article
    Congying Qiu, Xiantao Guan, Zhen Liu, Anna Zhu, Keping Yan. Degradation of organic dyes by nanosecond pulsed discharge plasma[J]. High Power Laser and Particle Beams, 2020, 32(2): 025010 Copy Citation Text show less
    Schematic diagram of the corona discharge reactor experimental setup电晕放电试验装置示意图
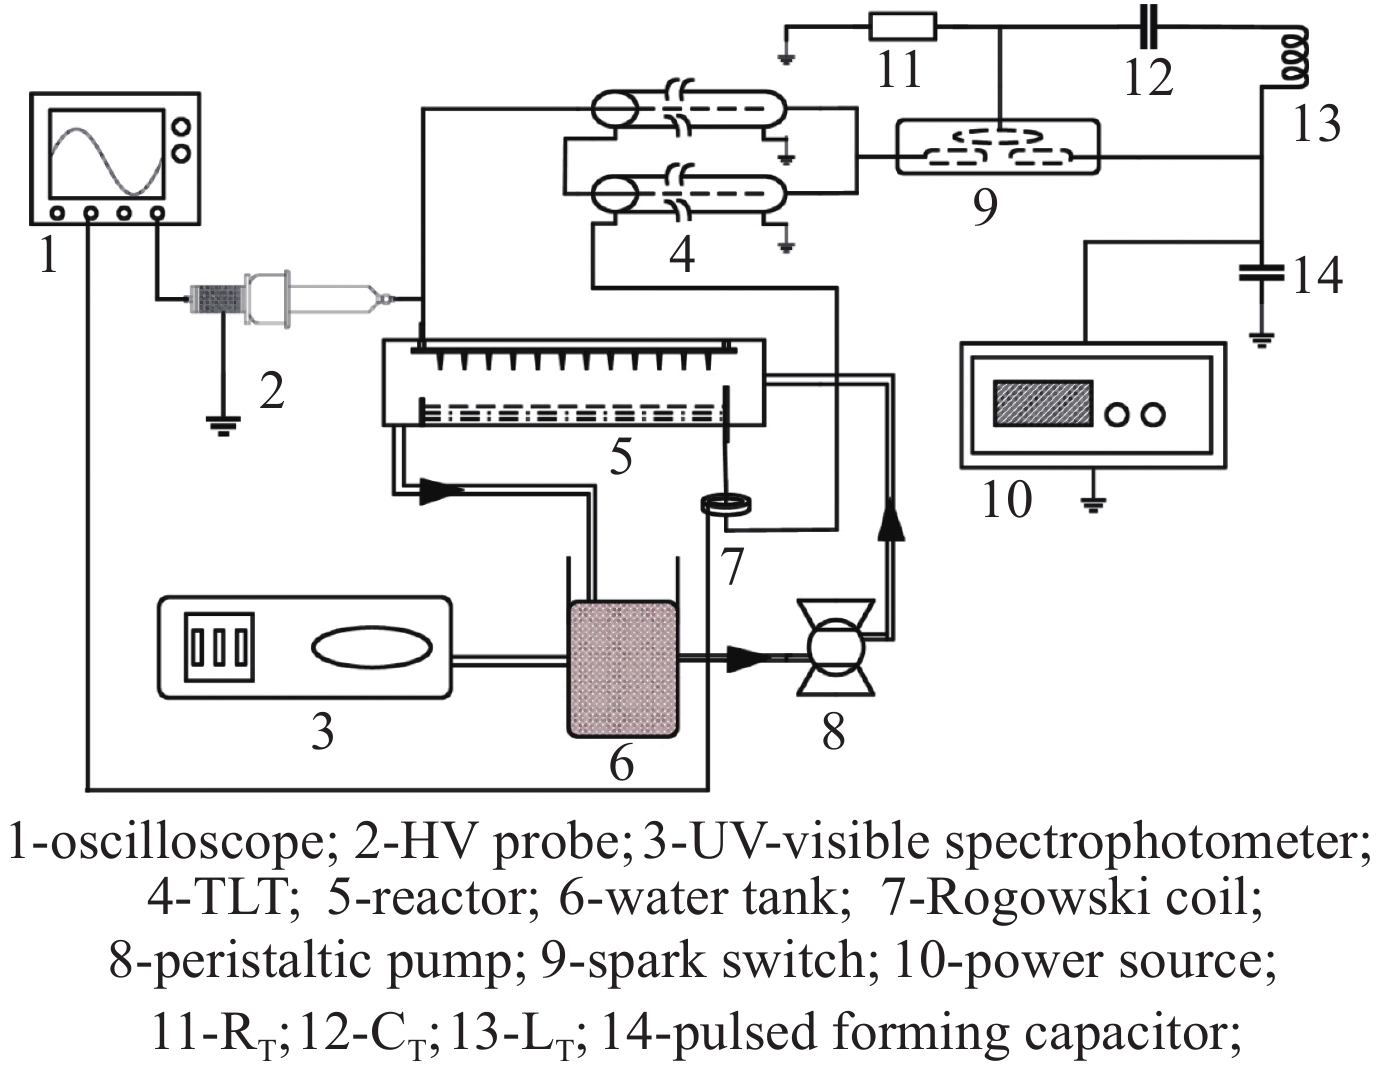
    Fig. 1. Schematic diagram of the corona discharge reactor experimental setup电晕放电试验装置示意图
    Schematic diagram of the reactor for water treatment水处理反应器结构示意图
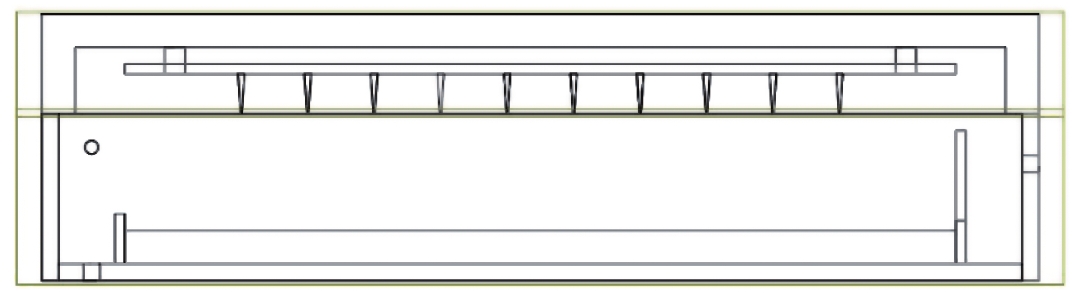
    Fig. 2. Schematic diagram of the reactor for water treatment水处理反应器结构示意图
    Standard curve of AR73酸性红73标准曲线
    Fig. 3. Standard curve of AR73酸性红73标准曲线
    Typical waveforms of output voltage and current电压与电流波形
    Fig. 4. Typical waveforms of output voltage and current电压与电流波形
    Typical photograph of the corona discharge放电图片
    Fig. 5. Typical photograph of the corona discharge放电图片
    Charging voltage and peak voltage with different AC input不同交流输入下储能电容电压和放电峰值电压
    Fig. 6. Charging voltage and peak voltage with different AC input不同交流输入下储能电容电压和放电峰值电压
    Evolution of AR73 degradation efficiency with treatment time under various discharge voltages不同放电电压下酸性红73降解率随时间的变化曲线
    Fig. 7. Evolution of AR73 degradation efficiency with treatment time under various discharge voltages不同放电电压下酸性红73降解率随时间的变化曲线
    Evolution of H2O2 concentration with treatment time under various discharge voltages不同放电电压下过氧化氢浓度随时间的变化曲线
    Fig. 8. Evolution of H2O2 concentration with treatment time under various discharge voltages 不同放电电压下过氧化氢浓度随时间的变化曲线
    Effects of Esi on degradation of AR73 under various discharge voltages不同放电电压下AR73降解率随能量密度变化曲线
    Fig. 9. Effects of Esi on degradation of AR73 under various discharge voltages 不同放电电压下AR73降解率随能量密度变化曲线
    Evolution of AR73 degradation efficiency with treatment time under various discharge frequencies不同放电频率下酸性红73降解率随时间的变化曲线
    Fig. 10. Evolution of AR73 degradation efficiency with treatment time under various discharge frequencies不同放电频率下酸性红73降解率随时间的变化曲线
    Relation between energy per pulse and with discharge frequency不同频率下的单次脉冲能量
    Fig. 11. Relation between energy per pulse and with discharge frequency不同频率下的单次脉冲能量
    Evolution of H2O2 concentration with treatment time under various discharge frequencies不同放电频率下过氧化氢浓度随时间的变化曲线
    Fig. 12. Evolution of H2O2 concentration with treatment time under various discharge frequencies 不同放电频率下过氧化氢浓度随时间的变化曲线
    Effects of Esi on degradation of AR73 under various discharge frequencies不同放电频率下AR73降解率随能量密度变化曲线
    Fig. 13. Effects of Esi on degradation of AR73 under various discharge frequencies 不同放电频率下AR73降解率随能量密度变化曲线
    Effects of initial concentration on the degradation of AR73 with treatment time不同初始质量浓度下酸性红73降解率随时间的变化曲线
    Fig. 14. Effects of initial concentration on the degradation of AR73 with treatment time不同初始质量浓度下酸性红73降解率随时间的变化曲线
    Effects of initial concentration on the energy efficiency with treatment time不同初始质量浓度下能量效率随时间的变化曲线
    Fig. 15. Effects of initial concentration on the energy efficiency with treatment time不同初始质量浓度下能量效率随时间的变化曲线
    Congying Qiu, Xiantao Guan, Zhen Liu, Anna Zhu, Keping Yan. Degradation of organic dyes by nanosecond pulsed discharge plasma[J]. High Power Laser and Particle Beams, 2020, 32(2): 025010
    Download Citation