1Advanced Photonic Technology Laboratory, College of Electronics and Optical Engineering & College of Microelectronics, Nanjing University of Posts and Telecommunications, Nanjing 210023, China
2Optical Communications Laboratory, Ocean College, Zhejiang University, Zhoushan 316021, China
3Aston Institute of Photonic Technologies, Aston University, Birmingham B4 7ET, UK
Fang Fang, Bing Sun, Zuxing Zhang, Jing Xu, Lin Zhang, "Improvement on refractive index sensing by exploiting the tapered two-mode fibers," Chin. Opt. Lett. 17, 110604 (2019)
Copy Citation Text
The spectral characteristics and sensitivities of a tapered two-mode fiber sandwiched between two single-mode fibers are systematically investigated. Theoretical calculations reveal that a dispersion turning point (DTP) appears when the group effective refractive index (RI) difference between the fundamental mode and the higher-order mode equals zero; as a result, ultrahigh RI sensitivities can be achieved. Furthermore, the location of the DTP is strongly dependent on the tapering condition. Then, we experimentally demonstrate high sensitivities of the RI sensor with the waist diameter of ~4 μm by means of immersing it in a flow cell filled with glycerol solution. In further tracking of the resonant wavelength shift around the DTP, it is found that the proposed RI sensor exhibits a sensitivity of 1.81 × 10⁴ nm/RIU and a limit of detection down up to 3.29 × 10 5 RIU in a liquid glycerol solution.
The growing need for highly sensitive and robust refractive index (RI) sensors engaged in a wide range of fields, especially in biochemical analysis, food safety, environmental monitoring, and industry process monitoring, has driven the study of various sensing schemes. For instance, the monitoring of contaminants and impurities such as preservatives in natural and daily foods is critical in food safety[1]. Also, the measurements of salinity in the aspects of oceanics, marine environment monitoring, seasonal climate prediction, mariculture, and solar engineering are a complex subject. Moreover, there is a need to measure small RI changes in small volumes of liquid in the bio-sensing field. Traditional bulk refractometers are then not appropriate due to their inconvenient size and weight. Among the demonstrated sensing schemes, fiber-optic RI sensors (FORISs) offer distinctive light–matter interactions, along with their unique advantages of compact footprint, short response time, immunity to electromagnetic interferences, and the possibility of distributed sensing[2–11].
Various FORISs with different sensing schemes have been developed, though most of these studies are limited to aqueous solution with high RI, which is higher than the RI of silica. Wu et al.[12] demonstrated a microfluidic RI sensor based on a directional coupler architecture with a sensitivity of 30,100 nm/RIU. It had to admit that the evanescent field propagating through low-index analytes (e.g., the RI ranges from 1.33 to 1.35) could not be well confined and enhanced, which led to a challenge in designing low-index RI sensors with high sensitivity. To solve it, we previously proposed a sensing scheme with an analyte-filled microstructured core to achieve strong light–matter interaction, where the sensitivity could reach [13,14]. However, these structures involved a sophisticated filling technique, which further limited their applications.
It is well known that microfibers with lots of outstanding properties (e.g., flexible structure, strong evanescent field), have attracted various attentions in the fields of optical trapping, modes elimination, surface plasma excitation, nonlinear effect, and optical sensing[15–17]. In particular, microfibers with the advantage of a large evanescent field to overlap with the surroundings directly, breaking through the limitations of traditional sensing principles, have been widely applied in various liquid and gas detecting environments[18–24]. Specially, microfibers working at the dispersion turning point (DTP) can present infinite RI sensitivities. Luo et al. reported a high RI sensitivity of 10,777.8 nm/RIU when the fiber was working around the RI of 1.3334 with the diameter of 4.6 μm[18]. Wang et al. further demonstrated an ultrahigh-sensitivity sensing in aqueous solution for a microfiber modal interferometer (MMI) with a waist diameter of 3.2 μm[8]. It should be noted that both of the abovementioned microfibers were concentrated on the utilization of single-mode fiber (SMF) configurations at the cost of thinner waist diameters; as a result, it led to a drastic reduction of structure robustness. Similarly, DTP can be developed to work on fiber couplers. For example, Li et al. experimentally demonstrated an ultrahigh sensitivity of 39,541.7 nm/RIU at a low ambient RI of 1.3334 based on an optical microfiber coupler (OMC) with the diameter of 1.4 μm[19]. Then, the group took advantage of the microfiber couplers to fulfil several interesting works[9,20]. In addition, Zhou et al. demonstrated a microfiber coupler operating around the DTP to develop the ultrasensitive detection of cardiac troponin I, which showed a linear wavelength shift in the range of 2–10 fg/mL and an ultralow detection limit of 2 fg/mL[21].
Sign up for Chinese Optics Letters TOC. Get the latest issue of Chinese Optics Letters delivered right to you!Sign up now
In this study, a high-sensitivity RI sensor involving a tapered two-mode fiber (TTMF) sandwiched between two SMFs has been experimentally demonstrated. Theoretical analysis reveals that the location of the DTP strongly depends on the external index and the waist diameter of the TTMF. Further numerical results indicate that the RI sensitivity can be significantly enhanced when it works around the DTP. To consider the IR absorption band in water solutions around 1360–1600 nm, our TTMF structure can be easily adjusted through the waist diameter to operate away from the absorption band. As a result, an ultrahigh sensitivity of is realized with the waist diameter of μ, against which fabrication and integration of an OMC in a chamber is a challenge.
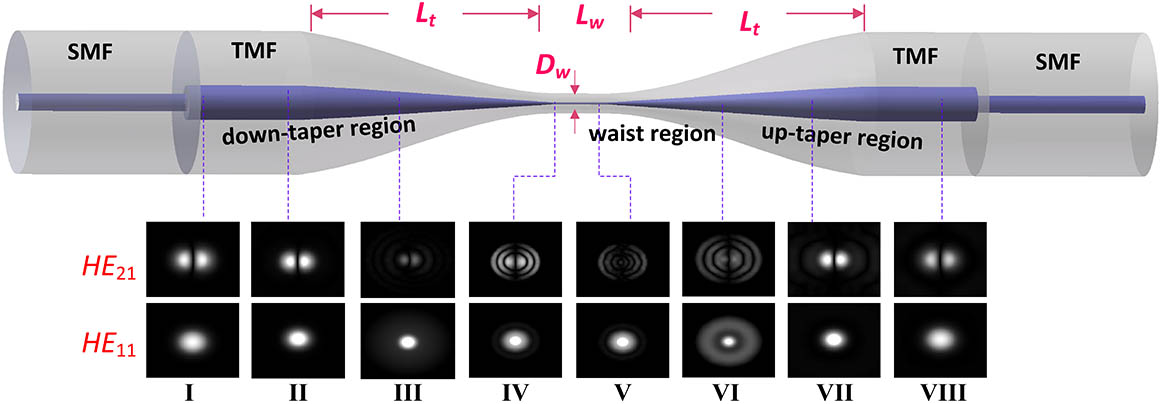
Simulation. Figure 1 shows the schematic diagram of the proposed RI sensor structure, which consists of an input SMF, a section of TTMF, and an output SMF. The TTMF consists of lengths of a uniform waist (), symmetric transition regions (), and the waist diameter (). We notice that the modes in a two-mode fiber (TMF) can be easily excited either by a lateral offset splicing[25] or introducing lateral stress points[26] or a tapering technique[27]. The tapering technique has involved an efficient and fast process, and the TTMF can result in much more uniform modal interferometric spectra than that of the tapered SMF. Actually, we previously reported a magnetic field sensing structure based on the same TMF, where the unique RI profiles and core/cladding dimension of the TMF contribute to this leading. Obviously, the power is primarily distributed in the and modes; then, the two modes construct the uniform interference pattern, while the and modes may have a very small contribution to the interference pattern[27–29]. Commonly, the noise appearing in the interferometric spectra is mainly caused by the multimode beating in the SMF[30].
Figure 1.Schematic diagram of the sensor. Continuous-mode evolutions of and modes when the two modes are launched into the fiber, respectively.
The separate propagation processes of the and modes as an example are illustrated with a wide-angle beam propagation method[28] in order to ensure such modes can be confined well in the whole taper region. Firstly, the light cannot be well confined in the core and partially spreads to the cladding in the down-taper region, as depicted in the and mode evolutions (I, II, and III). Gradually, the decreased cladding acts as a new core, and the external surrounding (e.g., liquid) is now the new cladding. The reassembled waveguide structure allows parts of power of such modes to be confined in the waist region, as shown in mode evolutions IV, V, and VI. It should be noted that the large numerical aperture (NA) results in a new normalized frequency. Finally, these modes gradually couple back in the up-taper region (e.g., mode distributions VI, VII, and VIII). Furthermore, according to the well-known description for modes, the transmission for a two-mode process takes the form where () is the transmitted factor resulting from coupling between the and modes, is the phase difference between and modes accumulated in the taper region, is the effective length of the taper region, and is the wavelength of the th resonance on the interference spectrum. Furthermore, the relationship between the th wavelength resonance and can be expressed as where the RI-induced variation of index difference and the dispersion factor coefficient G (1-) are dominated by the and . Actually, the number of modes existing in the TTMF strongly depends on and [27].
As illustrated in Fig. 2(a), the values of the dispersion factor coefficient G monotonically increase with the thinner microfiber, while the values of G are always negative at the wavelengths ranging from 1250 nm to 1650 nm when the microfiber is surrounded by air. By contrast, it is clearly seen from Fig. 2(b) that there are three typical regions (e.g., , , ) when immersed in a liquid with an RI of 1.33. According to Eq. (2), at the DTP when G approaches zero, the RI sensitivity dramatically becomes . Hence, Fig. 2(c) calculates RI sensitivities of the TTMF when operating at the DTP, and it agrees well with Eq. (2) that RI sensitivities are significantly enhanced. Of course the RI sensitivity varies rapidly on both sides of the DTP, and it can easily reach and above.
Figure 2.Calculated dispersion factor coefficient G along with the microfiber diameter variation in the external medium of (a) air and (b) 1.33. (c) Simulated RI sensitivities for the TTMF when μ.
Experiment. We utilized a broadband source with a low polarization spectrum ranging from 1250 nm to 1650 nm (www.optical-source.com) and an optical spectrum analyzer (AQ6371C) in the experimental setup. Firstly, a section of TMF was spliced between two SMFs, and the structure was mounted between two fiber clamps and heated by a hydrogen flame by means of utilizing the flame-brushing technique. Actually, we employed the flame-brushing technique system, which is involved with three stages assembled with electric motors, a hydrogen generator, and an oxyhydrogen torch. Thus, the pulling process was monitored by an online monitoring system, while the flow rate was controlled by the hydrogen generator; as a result, the waist diameter of the taper may be precisely controlled by monitoring the output power. The sample employed was fabricated in our experiments, where the pulling speed was set to 400 μm/s, and the hydrogen flow rate was chosen as 160 standard cubic centimeters per minute (sccm) with the purity of 99.999%.
As shown in Fig. 3(a), the transmission spectrum of one sample was recorded with a length of the uniform waist () and transition regions (), and the waist diameter was estimated to be μ. Thus, the taper structure was sophisticatedly incorporated into a home-made flow cell, while the corresponding spectrum presented no evident changes, which is shown in Fig. 3(b). It should be noted that the challenge with the thinner waist diameter to fix the taper structure in the flow cell was dramatically increased. So, our simple motivation that the appearance of the DTP allowed for the wider waist diameter in TMFs than other kinds of optical fibers was easily understood. On the other hand, the insertion loss of the TTMF was due to the mode field mismatching between the TMF and SMFs, and then the insertion loss was increased to be after packaging in a flow cell. Finally, the interference happened with a contrast fringe as high as 4 dB and an insertion loss as low as 1.5 dB when the TTMF was immersed in a liquid glycerol solution. By comparison, the tapered SMF structures possessed large insertion loss or irregular interferometric spectra, which was not suitable in the sensing field.
Figure 3.Variation of the interference spectra of the TTMF when immersed in (a) air, (b) flow cells, and (c) glycerol solution.
Furthermore, the DTP appears around 1320 nm when the glycerin solution was infiltrated into the flow cell [the gray area marked in Fig. 3(c)], which is similar to the descriptions in Refs. [8,9,19,20]. It should be noted that the location difference of DTP between the measured value and the simulated results may arise from the inaccuracy in the measurement of the diameter of the TTMF and the fiber parameters employed in this simulation. On the right side of the DTP, the interference fringes broaden and weaken, so we prefer to explain it as follows. On one hand, the glycerin solutions are mainly involved with water, and then the IR absorption band in water happened around 1360–1600 nm[8]. By contrast, the IR absorption can be relieved when the TTMF is immersed into a liquid (Laboratories Inc., index-matching fluid, series A)[27]. On the other hand, the proportion of the evanescent field of modes in the surrounding solution increased with the wavelength, while the glycerin solution induced large insertion loss. Furthermore, the interference fringes finally disappear as the wavelength increases, which is shown in Fig. 3(c).
In our reported work[29], the transmission spectral shift with the temperature was present. The experimental results revealed sensitivities of the resonant dips closest to the DTP, which provided the highest sensitivity of −18.8 nm/°C and 30.6 nm/°C, respectively; as a result, an improved sensitivity of ∼49.4 nm/°C was achieved.
We further investigate their spectral characteristics and RI sensing capabilities of the taper structure. Firstly, six glycerol solution samples with different weight concentrations are prepared for measurement, and the corresponding RIs (at 25°C) are 1.32658, 1.32688, 1.32759, 1.32784, and 1.32875 at the wavelength of 1.55 μm, which are measured by a V-Prism Refractometer. Note that the RI sensing measurement is implemented by filling the different concentrations of glycerin solution into the flow cell. Figure 4(a) illustrates the transmission spectra of the TMMF corresponding to various concentrations of glycerol solutions, which reveals that the resonant dip on the left side of the DTP shifts linearly toward a shorter wavelength, i.e., the so-called ‘blue’ shift when the surrounding RI increases. It should be noted that the theoretical mechanism behind the ‘blue’ shift needs further investigation in the following work. Furthermore, as shown in Fig. 4(b), we demonstrate sensitivities of the resonant dips closest to the DTP (dip A, dip B, and dip C), which provide high sensitivities of more than .
Figure 4.(a) Variation of interferential spectra as the ambient RIs increase from 1.32658 to 1.32875. (b) Wavelength shifts of dips (A, B, and C) versus ambient RIs.
Moreover, we calculate the RI detection limit of the proposed sensor according to the formulation , where is the full width defined as the wavelength width at the half-percentage of the resonant dip, and the signal-to-noise ratio (SNR) is in linear units [e.g., 50 dB gives 10(50/10)][31]. As plotted in Fig. 5, the evolution of power transmission as a function of the wavelength and dip A shifts 5.44 nm with an IR increase of only , which corresponds to a sensitivity (i.e., S) of . Compared with the reported sensitivity of [8], our TTMF structure may be improved by decreasing its waist diameter or adjusting the location of DTP to a longer wavelength. Furthermore, the spectral width of the resonance at is 15.88 nm. Assuming an SNR of 50 dB, we can get a detection limit of . The ultrahigh RI detection limit has great significance on trace detection in chemical and biological sensing applications.
Figure 5.Transmission spectra and FWHM of the proposed sensor in glycerol solution with RI ranging from 1.32658 to 1.32688.
In conclusion, we have comprehensively investigated the RI response of the TTMF operated around the DTP. Theoretical and experimental results indicate that ultrahigh RI sensitivities (with a sensitivity up to ) have been achieved. It should be noted that the mechanism involved in the shift direction (i.e., ‘blue’ shift) of the transmission spectra needs further exploration since the phenomenon differs from other reported works[18,19]. Moreover, it is expected that the proposed RI sensor could serve as a necessary step towards potential applications for fast and accurate quantification of biomedical concentrations in clinical settings with a simple detection scheme and short response time, which contributes to the development of compact immunosensors.
Fang Fang, Bing Sun, Zuxing Zhang, Jing Xu, Lin Zhang, "Improvement on refractive index sensing by exploiting the tapered two-mode fibers," Chin. Opt. Lett. 17, 110604 (2019)