
Xiaoyi Lu, Ting Yun, Lianfeng Xue, Qiangfa Xu, Lin Cao. Effective Feature Extraction and Identification Method Based on Tree Laser Point Cloud[J]. Chinese Journal of Lasers, 2019, 46(5): 0510002
- Chinese Journal of Lasers
- Vol. 46, Issue 5, 0510002 (2019)
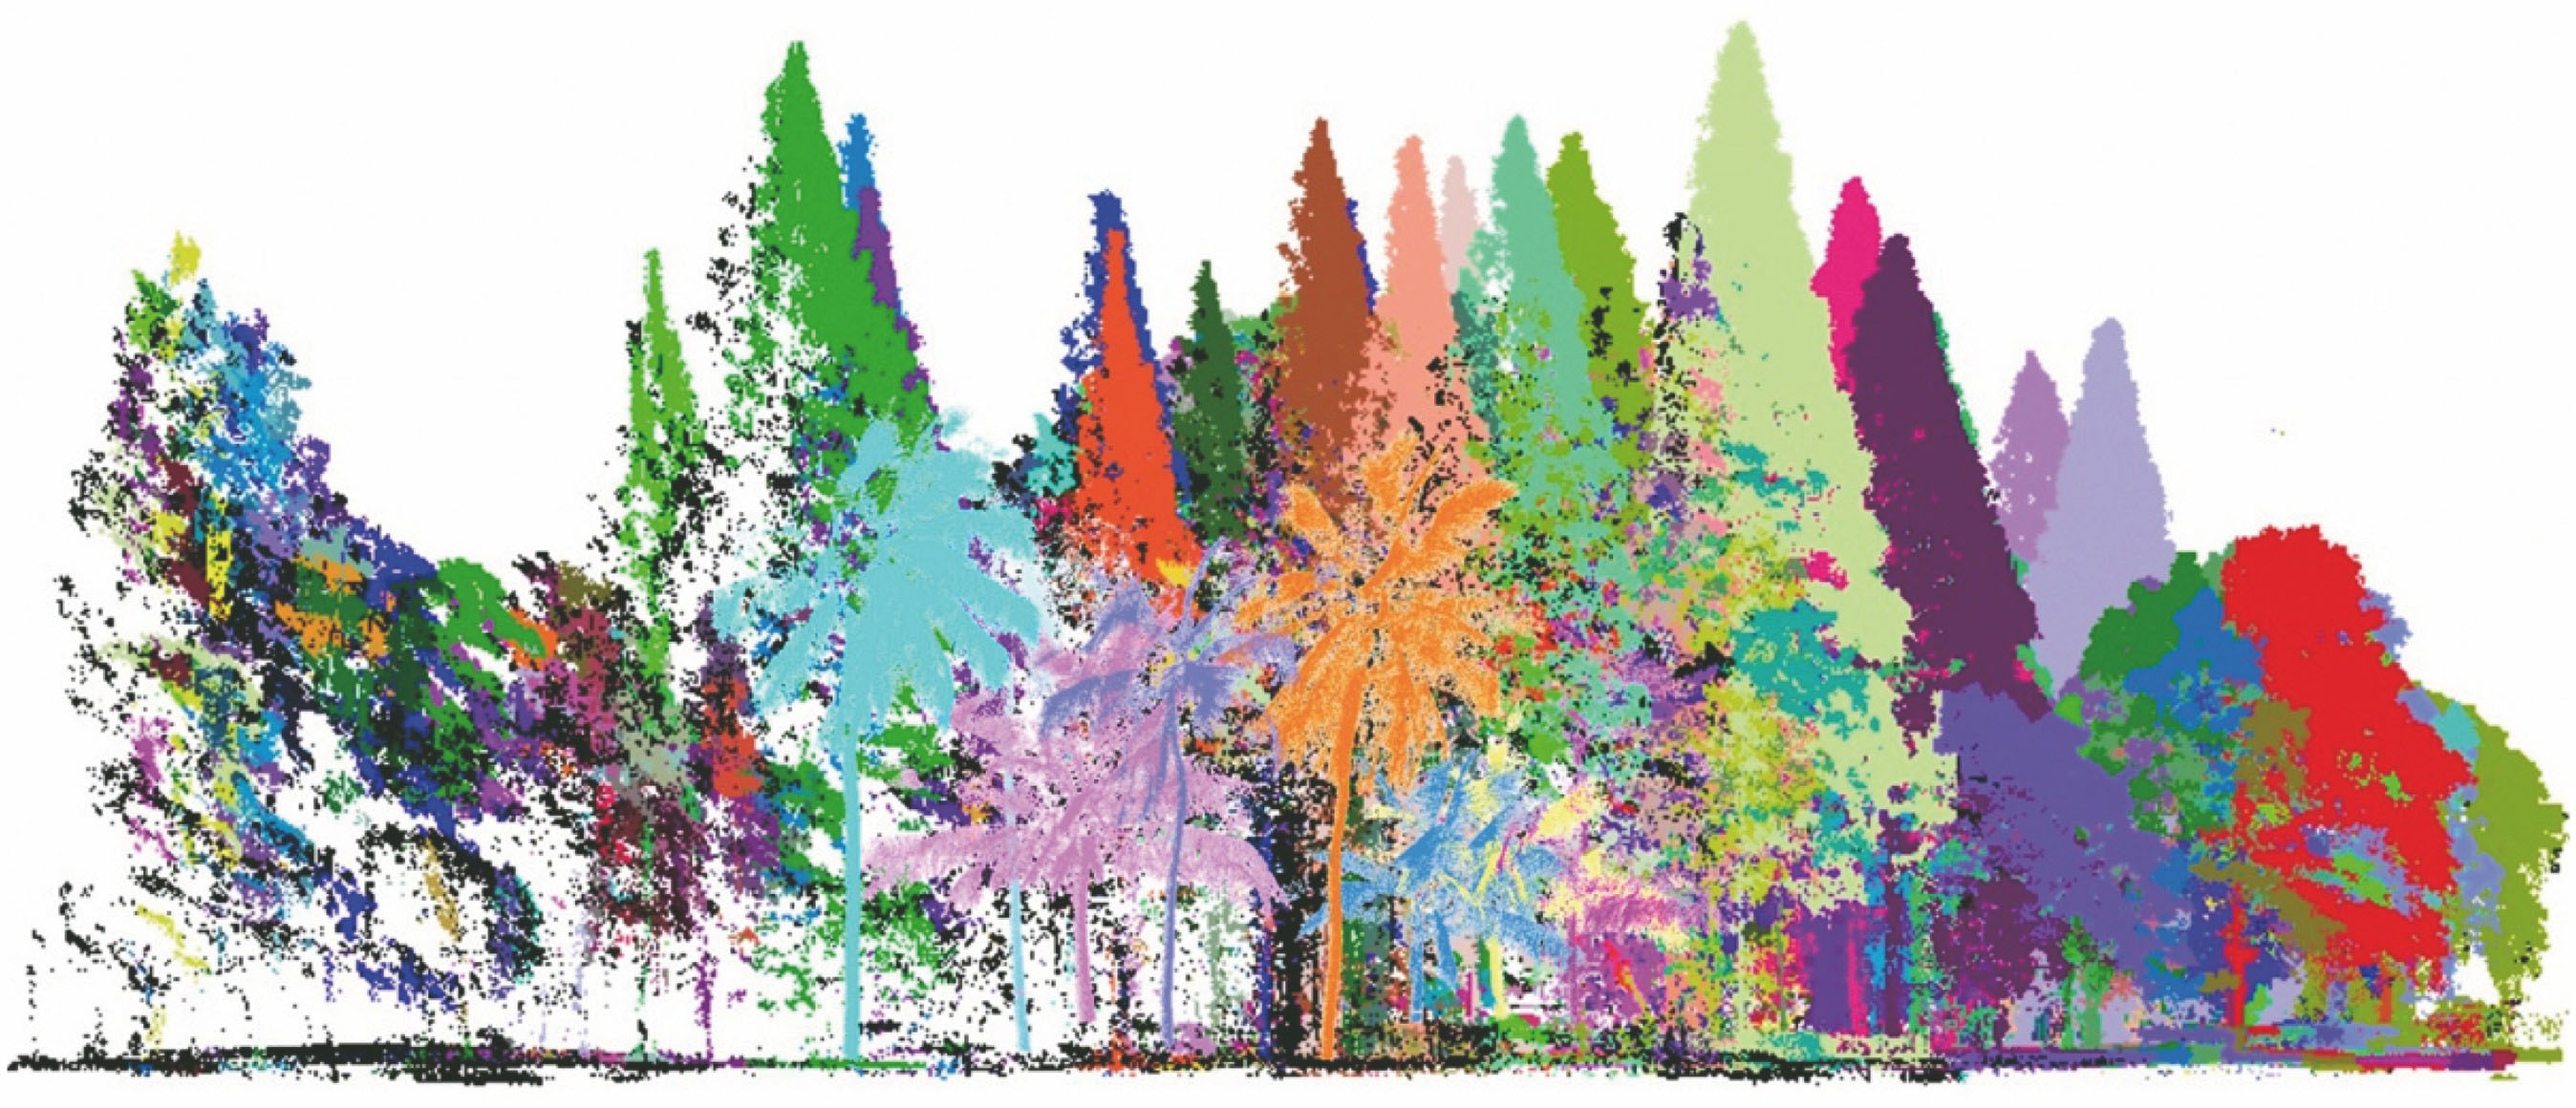
Fig. 1. Delineation effect of individual tree in an example area of Nanjing Forestry University
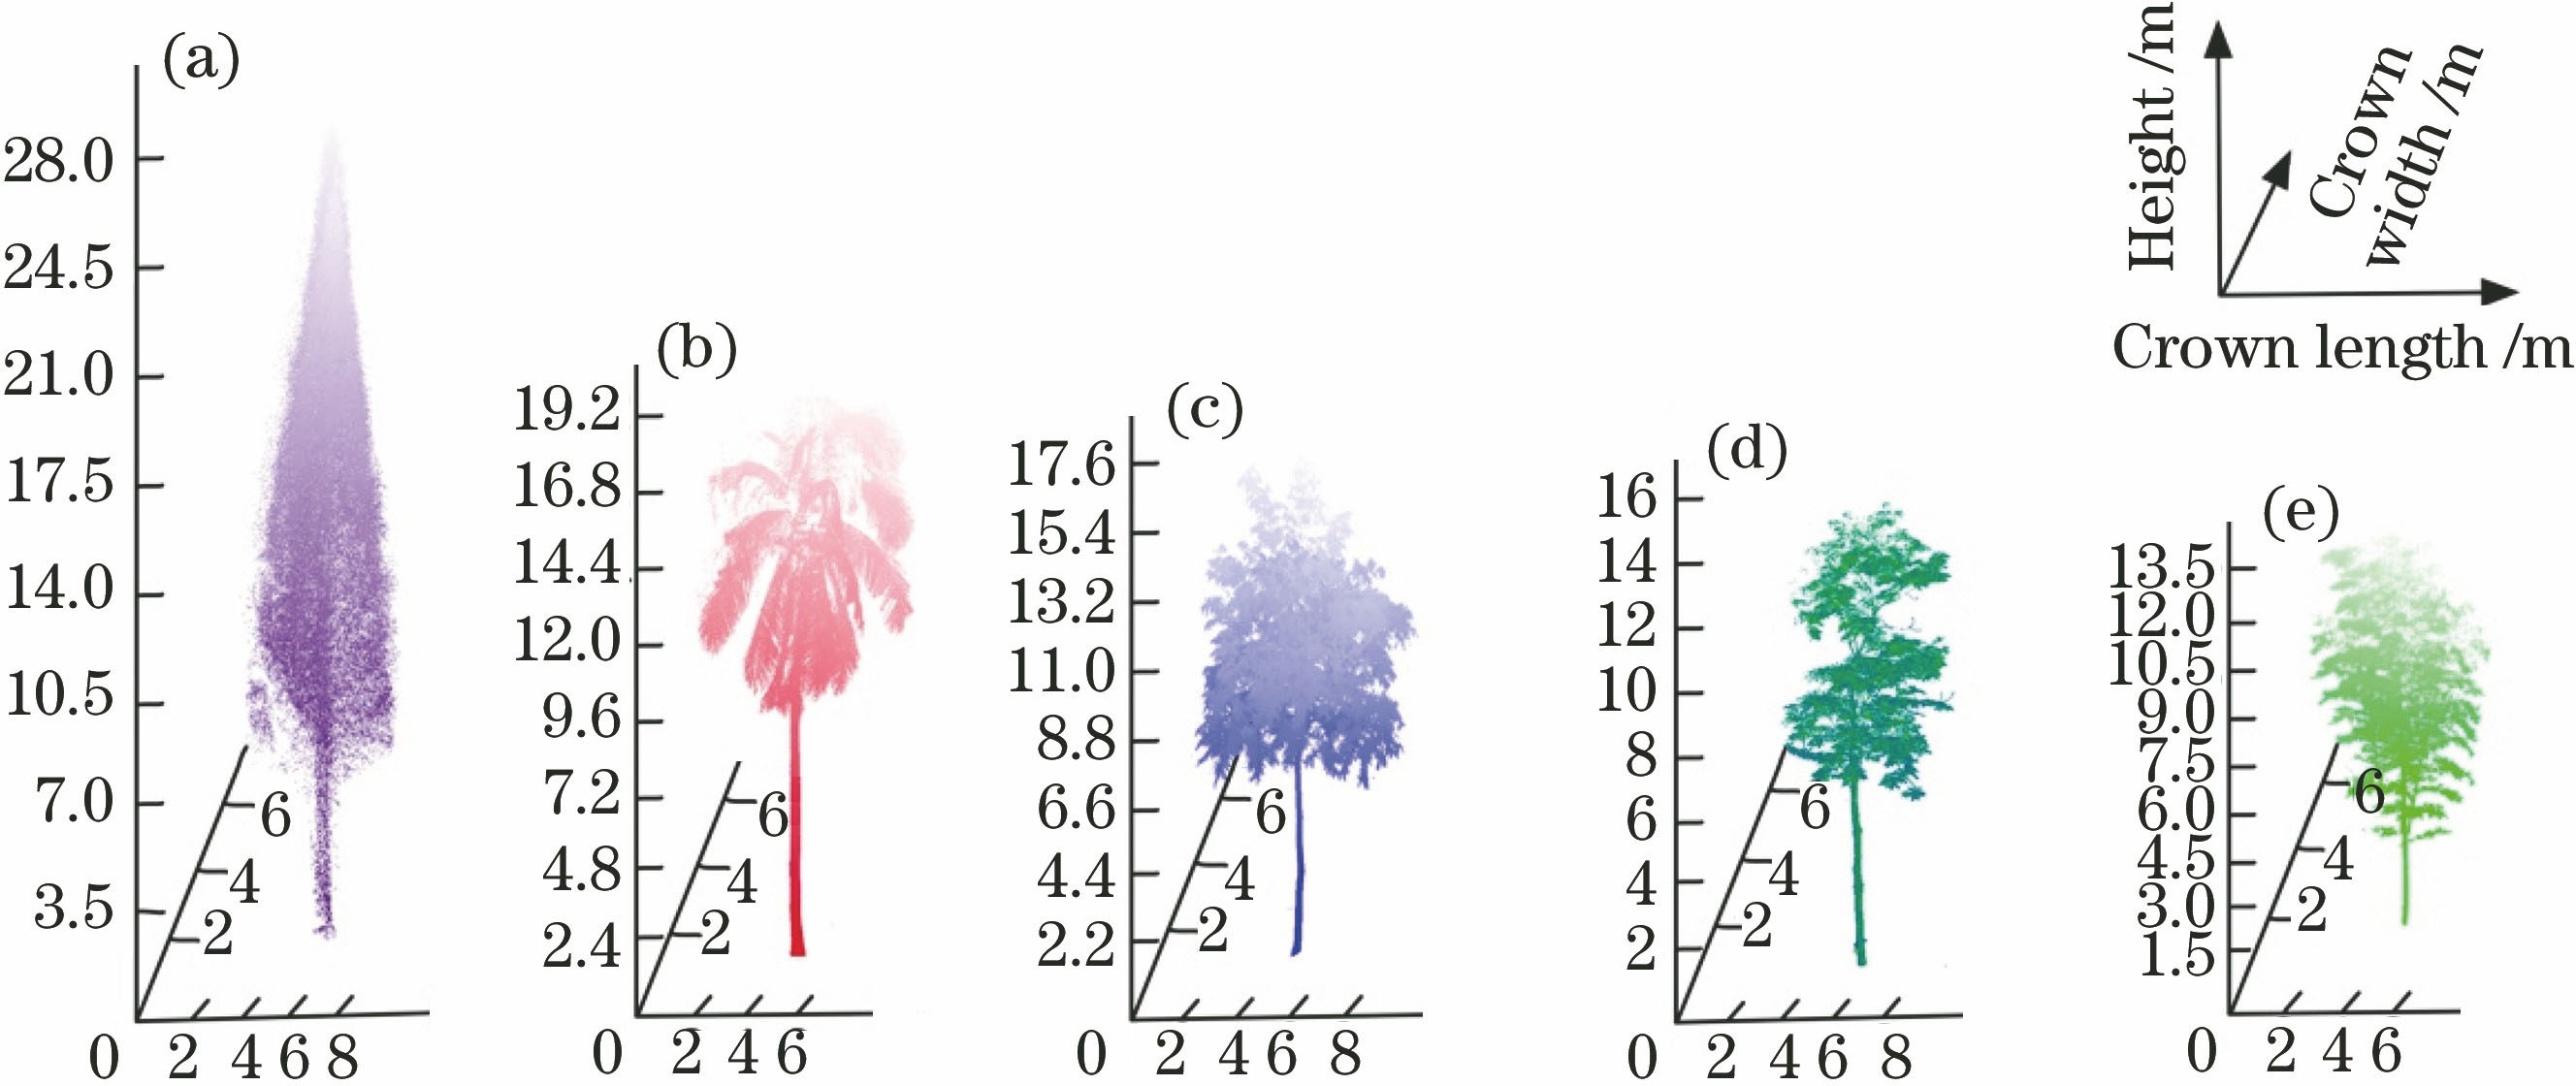
Fig. 2. Scanned point clouds of sample trees. (a) Metasequoia; (b) palm; (c) spaindus; (d) rubber tree; (e) bamboo
Fig. 3. Overview of work flow of tree species identification
Fig. 4. Schematic of definition of partial parameters associated with apparent characteristics of trees. (a) Side view of sample tree (rubber tree); (b) top view of sample tree (rubber tree)
Fig. 5. Schematic of acquisition of features related to grids in apparent characteristics of trees. (a) Top view of sample tree (rubber tree) divided into 8 segements and central vertical section of each segement; (b) schematic for meshing central vertical section
Fig. 6. Sample trees (rubber tree and metasequoia) described based on results of V -feature. (a) Scanned point clouds of rubber tree and point cloud projections in the second and eighth rectangular layers; (b) scanned point clouds of metasequoia and point cloud projections in the second and eighth rectangular layers; (c) line chart indicating V -feature of each layer for rubber tree and metasequoia
Fig. 7. Sample trees (rubber tree and metasequoia) described based on results of L -feature. (a) Point cloud projections and coordinate system representation regarding to Lk (r ) function for rubber tree and metasequoia in the second rectangular layer; (b) point cloud projections and coordinate system representation regarding to Lk (r ) function for rubber tree and metasequoia in the eighth rectangular
Fig. 8. Boxplots of classification accuracies based on relative clustering characteristics. (a) Based on V -feature; (b) based on L max-feature; (c) based on L min-feature; (d) based on r max-feature; (e) based on r min-feature
Fig. 9. Boxplots of classification accuracies based on features of point cloud distribution
Fig. 10. Boxplots of classification accuracies based on apparent features
Fig. 11. Boxplots of classification accuracies based on optimal features
Fig. 12. Classification map of individual tree species in an example area of Nanjing Forestry University based on optimal features
|
Table 1. Characterization of basic structures of sample trees in statistics
|
Table 2. Parameters associated with relative clustering characteristics of trees
|
Table 3. Classification results of cross-validation based on relative clustering features of {V 2,V 4,V 8,L
|
Table 4. Classification results of cross-validation based on features of point cloud distribution of {P H,R H40%-60%,R H60%-80%}
|
Table 5. Classification results of cross-validation based on apparent features of {R C/D,η crown,QL }
|
Table 6. Classification results of cross-validation based on optimal features of {V 2,V 4,V 8,L max_2

Set citation alerts for the article
Please enter your email address
© Copyright 2018-2021 | Chinese Laser Press. All Rights Reserved 沪ICP备15018463号-20