
Jaebum Park, Hector A. Baldis, Hui Chen, "The implementation and data analysis of an interferometer for intense short pulse laser experiments," High Power Laser Sci. Eng. 4, 03000e26 (2016)
- High Power Laser Science and Engineering
- Vol. 4, Issue 3, 03000e26 (2016)
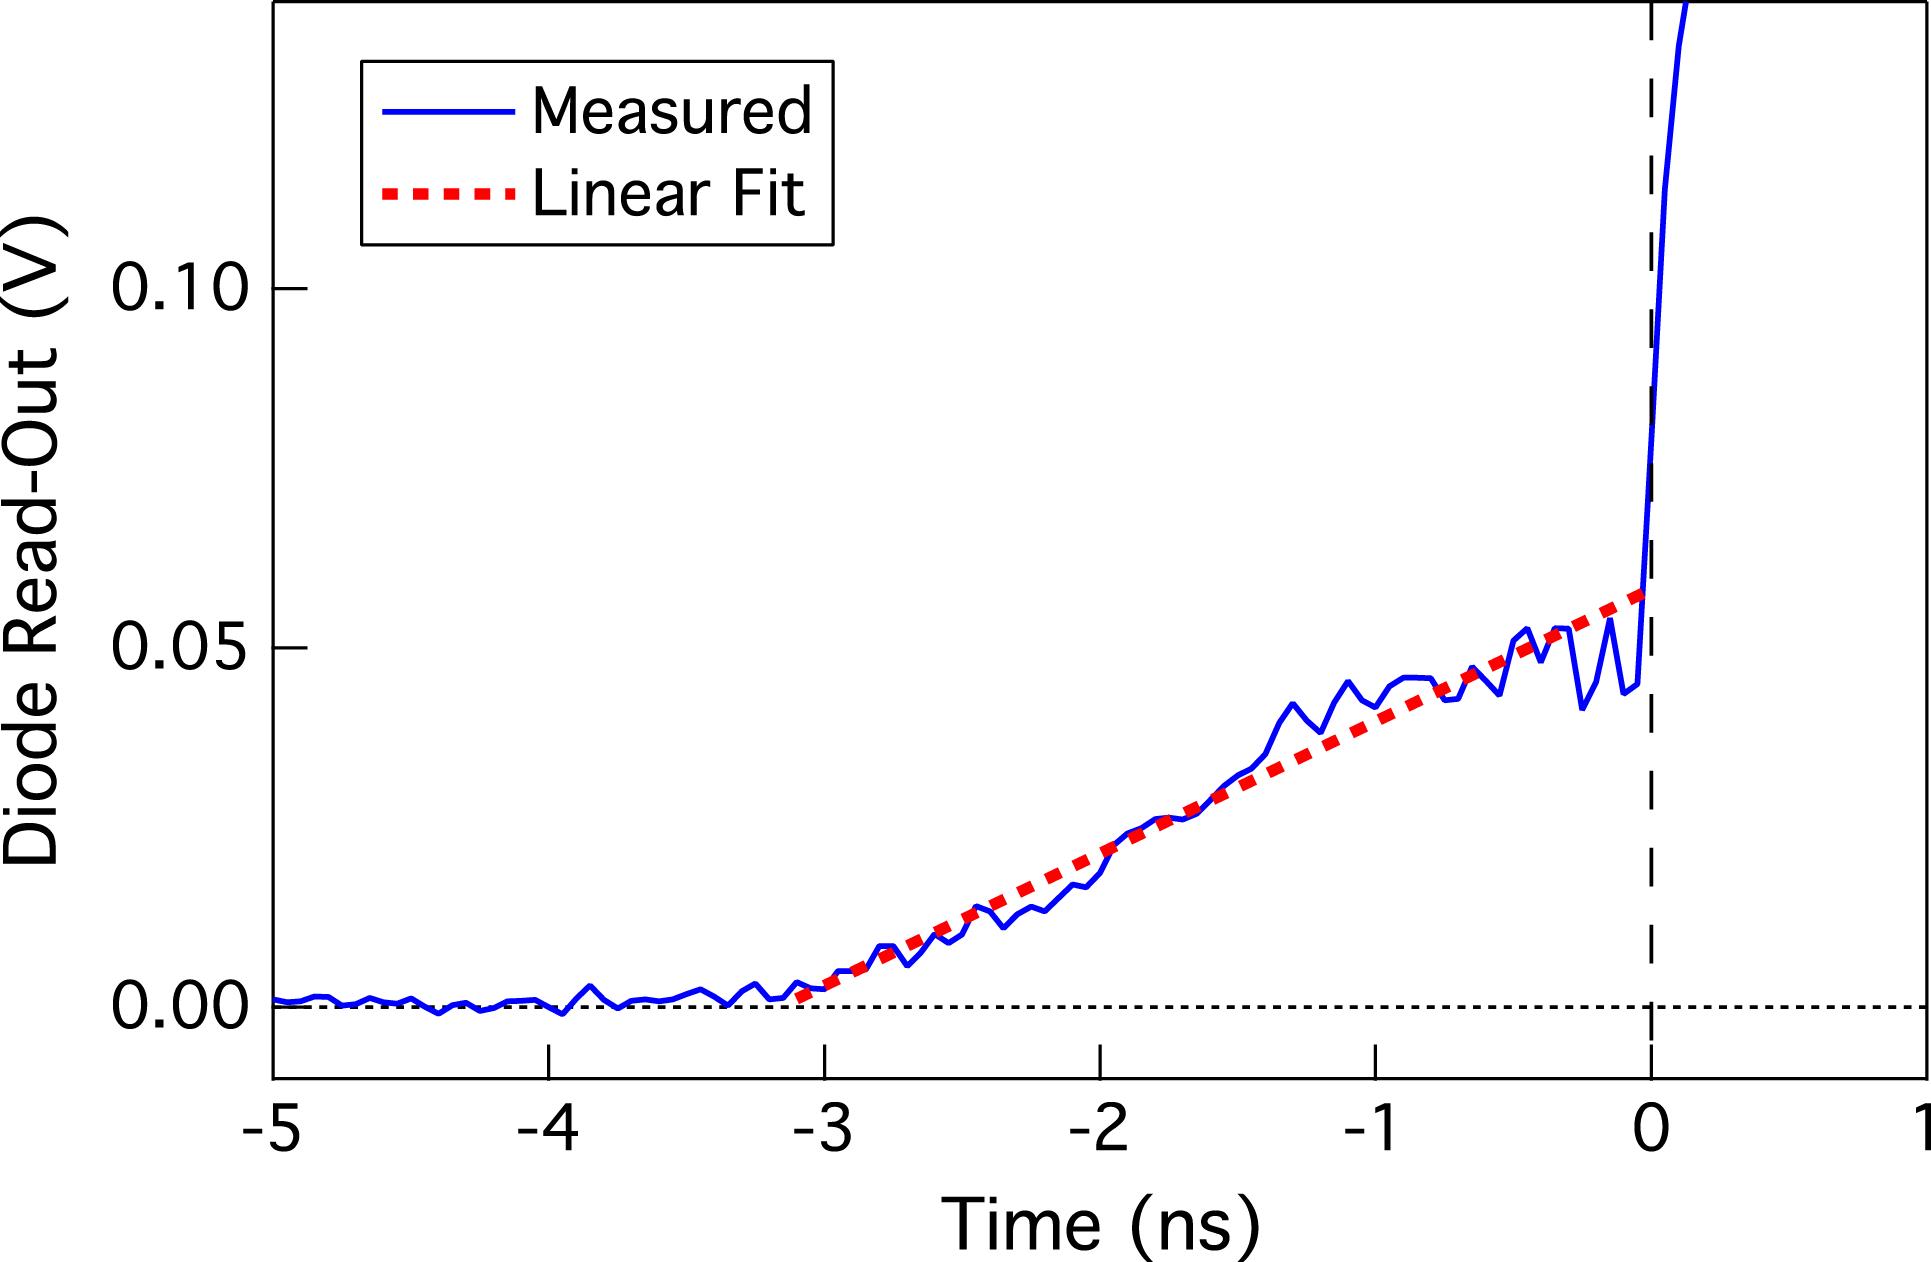
Fig. 1. The pre-pulse measured by the calibrated fast diode (solid blue) and a linear fit (dotted red).
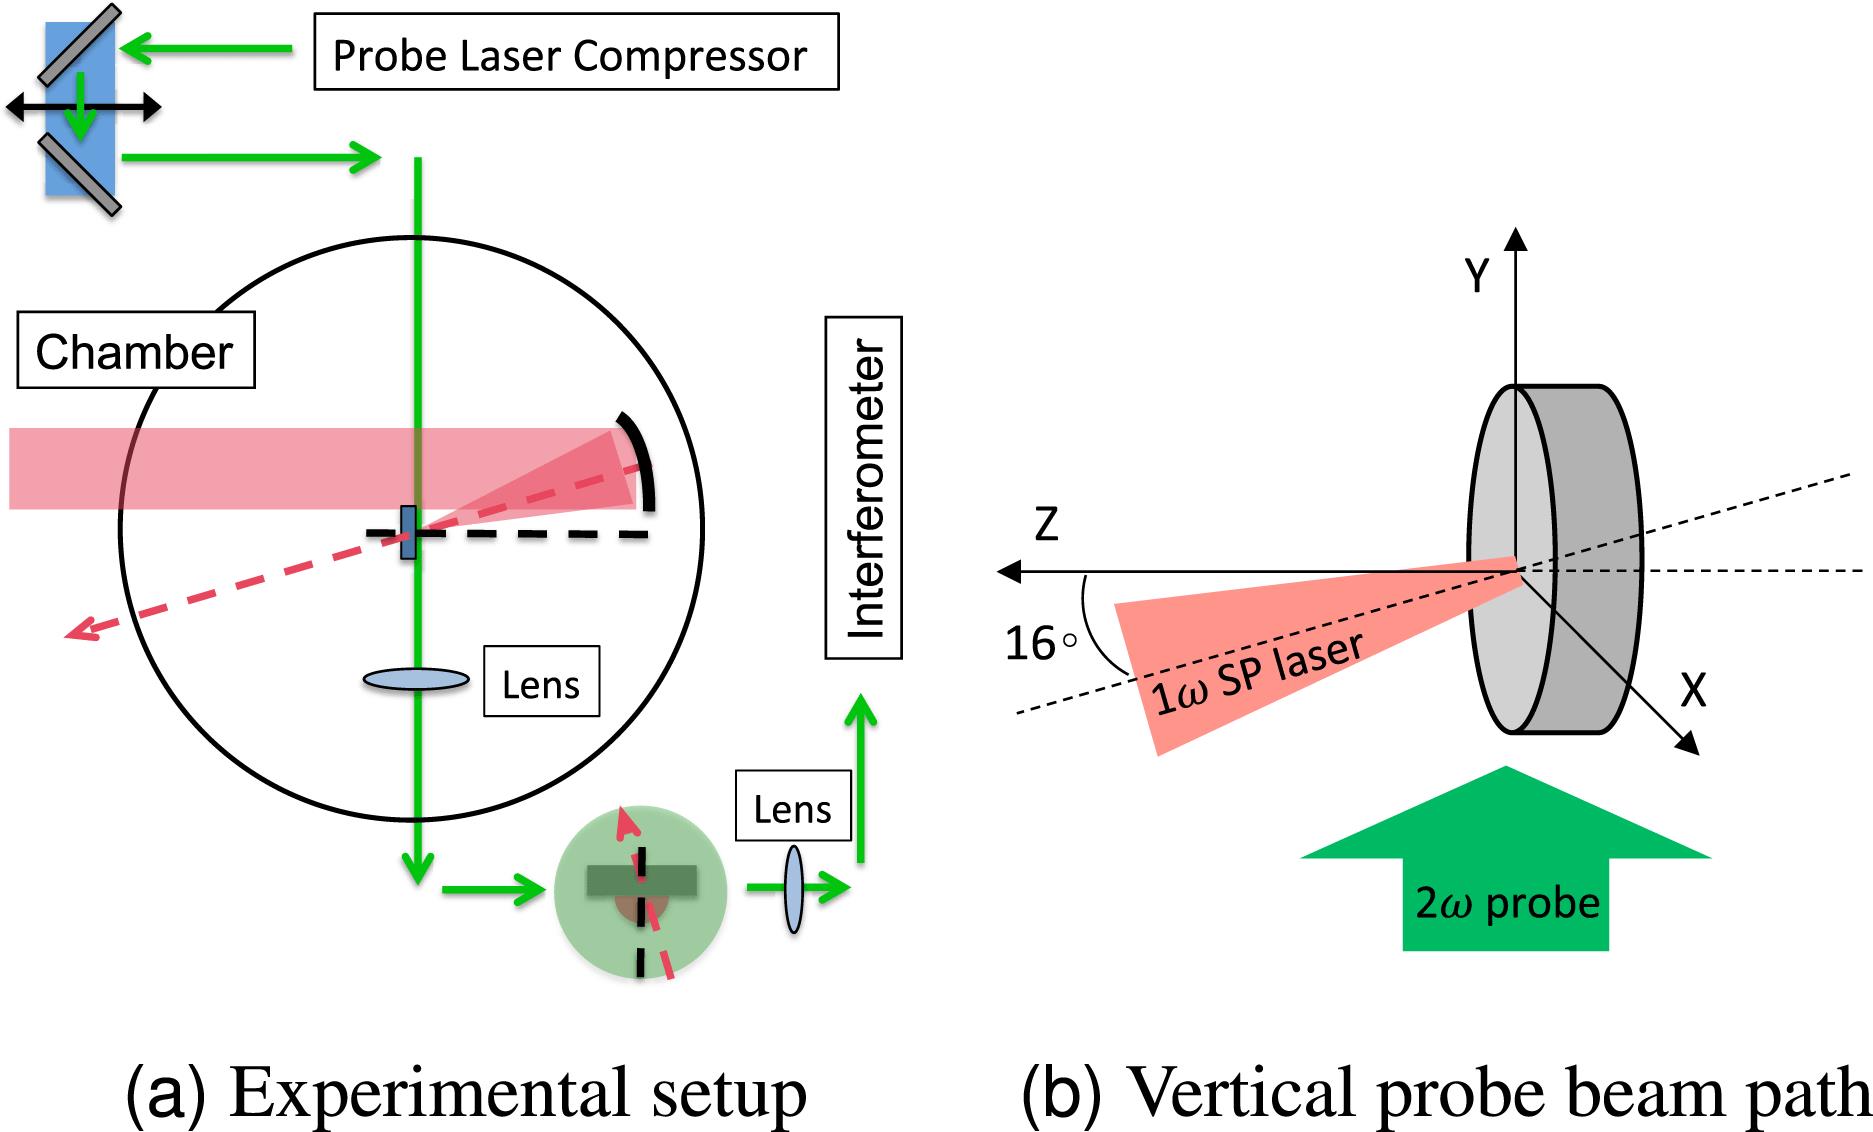
Fig. 2. (a) A simplified experimental scheme and (b) the single vertical probe beam path at the target position.
Fig. 3. An image captured by the streak camera (left top) and laser signals along the vertical line on the image (right bottom) are shown.
Fig. 4. A modified M–Z interferometer setup.
Fig. 5. Interferogram and phase maps. The red dotted line in (a) indicates the original target–vacuum interface.
Fig. 6. A cylindrical geometry and the Abel transformation variables.
Fig. 7. Two dimensional plasma density $(\text{cm}^{-3})$ profile extracted from the interferogram shown in Figure 5 . The white color indicates densities below $5\times 10^{18}~\text{cm}^{-3}$ .


Set citation alerts for the article
Please enter your email address

© Copyright 2018-2021 | Chinese Laser Press. All Rights Reserved 沪ICP备15018463号-20