• Photonics Research
  • Vol. 8, Issue 2, 211 (2020)
Iman Zand1、2 and Wim Bogaerts1、2、*
Author Affiliations
  • 1Photonics Research Group, Department of Information Technology, Ghent University-IMEC, 9052 Ghent, Belgium
  • 2Center of Nano and Biophotonics, Ghent University, 9052 Ghent, Belgium
  • show less
    DOI: 10.1364/PRJ.376227 Cite this Article Set citation alerts
    Iman Zand, Wim Bogaerts. Effects of coupling and phase imperfections in programmable photonic hexagonal waveguide meshes[J]. Photonics Research, 2020, 8(2): 211 Copy Citation Text show less
    (a) Summary of the simulation flow to study effects of parasitics. (b) Schematic representation of the seven-cell hexagonal mesh, where 2×2 couplers are connected to the phase shifters (PSs) through silicon waveguides. (c) For each mesh configuration, couplers are categorized to routing couplers (involved in defining light paths) and unused couplers (their state, in principle, does not affect the light paths). Orange and gray colors show cross and bar states of the routing couplers; unused couplers are shown only by the blue. Note that, in normal bar bias (NB bias), unused couplers are programmed in the bar state, while, in normal cross bias (NC bias), they are programmed in the cross state.
    Fig. 1. (a) Summary of the simulation flow to study effects of parasitics. (b) Schematic representation of the seven-cell hexagonal mesh, where 2×2 couplers are connected to the phase shifters (PSs) through silicon waveguides. (c) For each mesh configuration, couplers are categorized to routing couplers (involved in defining light paths) and unused couplers (their state, in principle, does not affect the light paths). Orange and gray colors show cross and bar states of the routing couplers; unused couplers are shown only by the blue. Note that, in normal bar bias (NB bias), unused couplers are programmed in the bar state, while, in normal cross bias (NC bias), they are programmed in the cross state.
    (a) Schematic of a routed path (with Lpath=10Lu) within a seven-cell mesh. (b) Transmission spectra of the mesh for two types of biasing: normal bar (NB), where unused couplers are biased in the bar state (red curves), and normal cross (NC), where unused couplers are biased in the cross state (green curves). The results are plotted for σk=0.05%, 0.4%, and 1.0% from left to right. (c) Intensity spread analysis of the transmission in the output for random variations of σk=0.05%, 0.4%, and 1.0%. Red and green error bars correspond to the NB and NC biases.
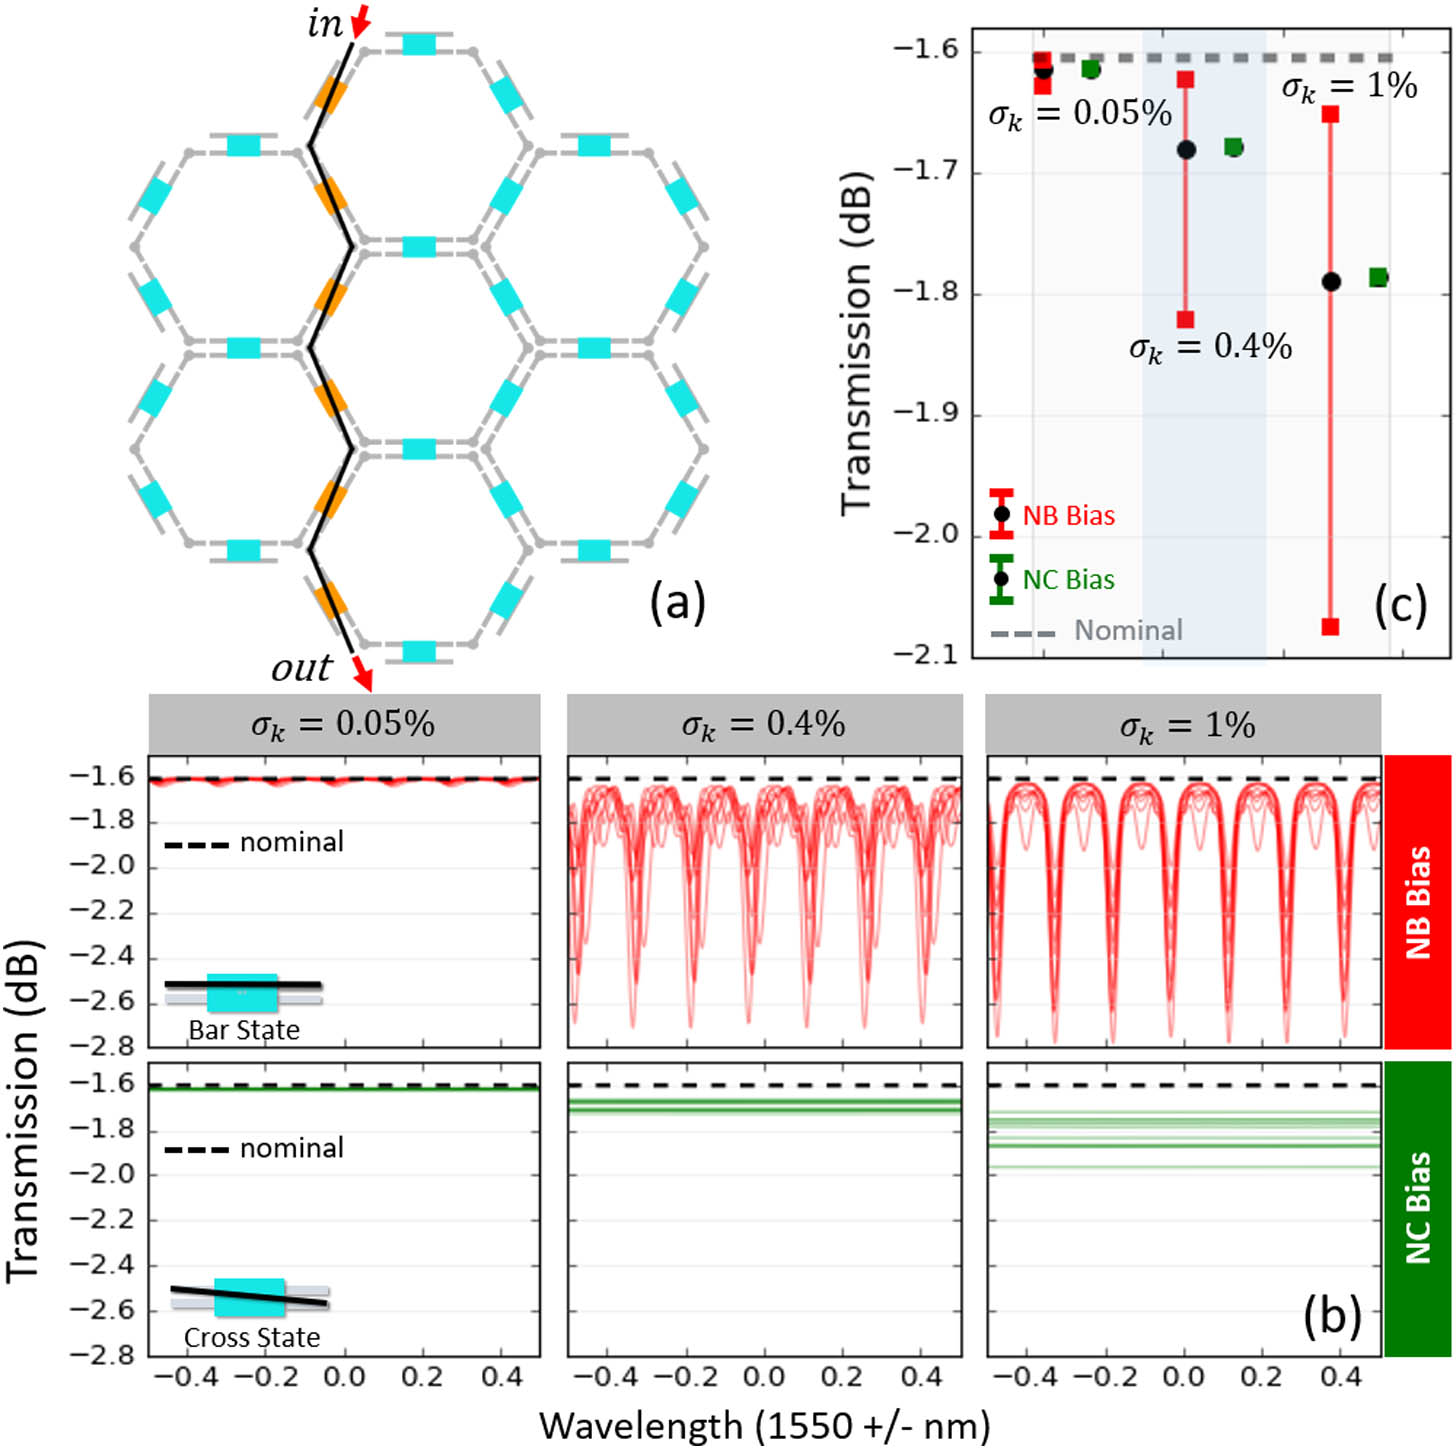
    Fig. 2. (a) Schematic of a routed path (with Lpath=10Lu) within a seven-cell mesh. (b) Transmission spectra of the mesh for two types of biasing: normal bar (NB), where unused couplers are biased in the bar state (red curves), and normal cross (NC), where unused couplers are biased in the cross state (green curves). The results are plotted for σk=0.05%, 0.4%, and 1.0% from left to right. (c) Intensity spread analysis of the transmission in the output for random variations of σk=0.05%, 0.4%, and 1.0%. Red and green error bars correspond to the NB and NC biases.
    Intensity spread analysis of different configurations of the seven-cell mesh to study both simple and complex paths. Blue couplers are in the bar (cross) state for the NB (NC) bias. Random variations of σk=0.05%, 0.4%, and 1.0% are chosen for the Monte Carlo simulations. Red and green error bars correspond to the NB and NC bias, respectively.
    Fig. 3. Intensity spread analysis of different configurations of the seven-cell mesh to study both simple and complex paths. Blue couplers are in the bar (cross) state for the NB (NC) bias. Random variations of σk=0.05%, 0.4%, and 1.0% are chosen for the Monte Carlo simulations. Red and green error bars correspond to the NB and NC bias, respectively.
    Intensity spread analysis of the (a) transmission and (b) crosstalk of double- and multipaths. Similar to the Fig. 2(c), error bars are plotted for σk=0.05%, 0.4%, and 1.0%.
    Fig. 4. Intensity spread analysis of the (a) transmission and (b) crosstalk of double- and multipaths. Similar to the Fig. 2(c), error bars are plotted for σk=0.05%, 0.4%, and 1.0%.
    (a) Schematic of the three different configured MZIs in the seven-cell hexagonal mesh (A: ΔL=6Lu, B: ΔL=4Lu, C: ΔL=10Lu). (b) Transmission response of the MZIs for NB (red) and NC (green) biases, where only 10 cycles of the Monte Carlo simulations have been plotted for better visibility. (c) Correlation-based analysis of the configured MZIs for (σk, σϕ) pairs of (0.05%, 17°), (1.0%, 17°), and (1.0%, 2°).
    Fig. 5. (a) Schematic of the three different configured MZIs in the seven-cell hexagonal mesh (A: ΔL=6Lu, B: ΔL=4Lu, C: ΔL=10Lu). (b) Transmission response of the MZIs for NB (red) and NC (green) biases, where only 10 cycles of the Monte Carlo simulations have been plotted for better visibility. (c) Correlation-based analysis of the configured MZIs for (σk, σϕ) pairs of (0.05%, 17°), (1.0%, 17°), and (1.0%, 2°).
    (a) Schematic of three different configured ring resonators in the seven-cell hexagonal mesh. (b) Transmission response of the selected configurations for NB (red) and NC (green) biases, where 10 cycles of the Monte Carlo simulations have been used. (c) Correlation-based analysis of the configured ring resonators for (σk, σϕ) pairs of (0.05%, 17°), (1.0%, 17°), and (1.0%, 2°).
    Fig. 6. (a) Schematic of three different configured ring resonators in the seven-cell hexagonal mesh. (b) Transmission response of the selected configurations for NB (red) and NC (green) biases, where 10 cycles of the Monte Carlo simulations have been used. (c) Correlation-based analysis of the configured ring resonators for (σk, σϕ) pairs of (0.05%, 17°), (1.0%, 17°), and (1.0%, 2°).
    Intensity spread analysis of a 1×4 splitter in the seven-cell hexagonal mesh. Red and green bars show NB and NC biases, respectively. Similar to Fig. 2(c), error bars are plotted for σk=0.05%, 0.4%, and 1.0%. For NC bias, blue couplers are in the cross state (k=1), while they are in the bar state (k=0) for NB bias.
    Fig. 7. Intensity spread analysis of a 1×4 splitter in the seven-cell hexagonal mesh. Red and green bars show NB and NC biases, respectively. Similar to Fig. 2(c), error bars are plotted for σk=0.05%, 0.4%, and 1.0%. For NC bias, blue couplers are in the cross state (k=1), while they are in the bar state (k=0) for NB bias.
    Intensity spread analysis of a 1×16 splitter in a seven-cell hexagonal mesh. Red and green bars also show NB and NC biases, respectively. Similar to Fig. 2(c), error bars are plotted for σk=0.05%, 0.4%, and 1.0%. For NC bias, blue couplers are in the cross state (k=1), while they are in the bar state (k=0) for the NB bias.
    Fig. 8. Intensity spread analysis of a 1×16 splitter in a seven-cell hexagonal mesh. Red and green bars also show NB and NC biases, respectively. Similar to Fig. 2(c), error bars are plotted for σk=0.05%, 0.4%, and 1.0%. For NC bias, blue couplers are in the cross state (k=1), while they are in the bar state (k=0) for the NB bias.
    Transmission spread analysis of a single path (with ΔL=8Lu) for different biasing schemes with σk=0.05%, 0.4%, and 1.0%.
    Fig. 9. Transmission spread analysis of a single path (with ΔL=8Lu) for different biasing schemes with σk=0.05%, 0.4%, and 1.0%.
    Iman Zand, Wim Bogaerts. Effects of coupling and phase imperfections in programmable photonic hexagonal waveguide meshes[J]. Photonics Research, 2020, 8(2): 211
    Download Citation