
Lu Qiao, Shi Lei, Mao Qinghe. Research Advances in Dual-Comb Spectroscopy[J]. Chinese Journal of Lasers, 2018, 45(4): 400001
- Chinese Journal of Lasers
- Vol. 45, Issue 4, 400001 (2018)
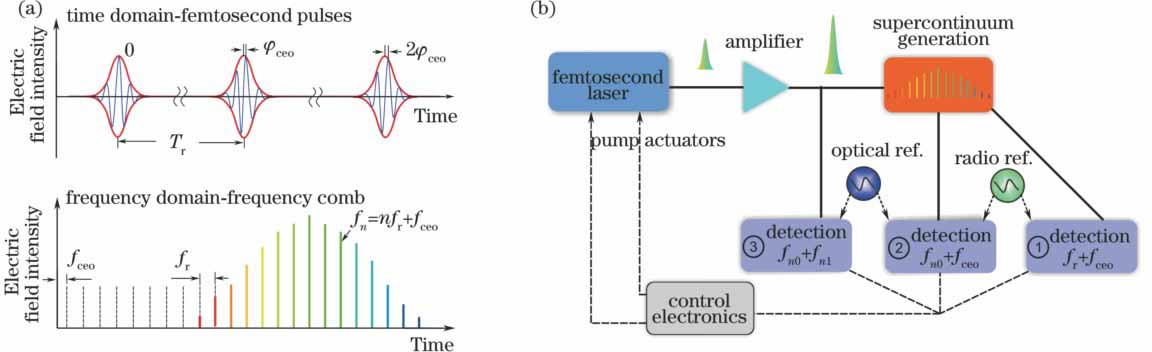
Fig. 1. (a) Time domain and frequency domain diagrams for pulse electric field of ideal mode-locking laser; (b) three typical locking schemes for OFCs
![(a) Schematic for actively measuring principle of OFC-based FTS[25]; (b) schematic for DCS measuring principle[25]; (c) asynchronous optical sampling and measuring process in time domain; (d) multiheterodyne in frequency domain for measuring process of DCS](/richHtml/zgjg/2018/45/4/0400001/img_2.jpg)
Fig. 2. (a) Schematic for actively measuring principle of OFC-based FTS[25]; (b) schematic for DCS measuring principle[25]; (c) asynchronous optical sampling and measuring process in time domain; (d) multiheterodyne in frequency domain for measuring process of DCS
Fig. 3. Configuration of OFC locked with optical frequency reference scheme[24]
Fig. 4. (a) Configuration of coherent DCS[36]; (b) measured phase and transmission spectra for HCN sample[36];(c) local zoom near 195 THz in Fig.4(b), measured phase (green curve) and transmission spectra (black curve) agree well with theoretical results (dotted blue line, and offset by 0.1 rad) calculated from absorption data through Kramers-Kronig relation[36]
Fig. 5. (a) Experimental site layout of open-path multicomponent greenhouse gas online measurements with coherent DCS[59]; (b) comparison of results of greenhouse gases measured by coherent DCS with those calculated with HITRAN database[59]; (c) photograph of vehicle-borne OFC[61]
Fig. 6. (a) Adaptive DCS scheme based on tracking-recording error signal technique with FBG[37]; (b) measured results with adaptive DCS[37]
Fig. 7. (a) Schematic of adaptive DCS based on CW laser references[22]; (b) comparison of C2H2 absorption spectra respectively measured by constant and adaptive clocks sampling with those obtained by using HITRAN database[22]
Fig. 8. Configuration and measuring principle of DCS scheme based on single OFC with repetition rate tuned and time-delay-multiplexing technique[27]. (a) Configuration; (b) measuring principle
Fig. 9. (a) DCS based on single laser source with dual-output ports extract lights respectively propagating in different directions inside cavity[57]; (b) DCS with dual-wavelength mode-locked fiber laser[30]
Fig. 10. Operation principles and realization schemes for improving spectral resolution of DCS with (a) phase-modulated pulse technique[66]and (b) spectral interleave scheme[69]
Fig. 11. Measureable wavebands and spectral ranges for DCS published
Fig. 12. Coherent Raman DCS and its measured spectral and imaging results[75]
|
Table 1. Performance indexes for reported DCS

Set citation alerts for the article
Please enter your email address
© Copyright 2018-2021 | Chinese Laser Press. All Rights Reserved 沪ICP备15018463号-20