• Acta Photonica Sinica
  • Vol. 50, Issue 5, 204 (2021)
Xiangbo LI1, Jun GONG2, Dan HU2, Jianwen SONG1, and Kai LIU1
Author Affiliations
  • 1College of Electrical Engineering, Sichuan University, Chengdu60065, China
  • 2Chengdu Institute of Product Quality Inspection Co.,Ltd, Chengdu610199, China
  • show less
    DOI: 10.3788/gzxb20215005.0512001 Cite this Article
    Xiangbo LI, Jun GONG, Dan HU, Jianwen SONG, Kai LIU. Quality Assessment Method of Speckle Patterns Based on Correlation Coefficient of Adjacent Subsets[J]. Acta Photonica Sinica, 2021, 50(5): 204 Copy Citation Text show less
    Distribution of ZNCC scores between adjacent subsets for different subset radius r
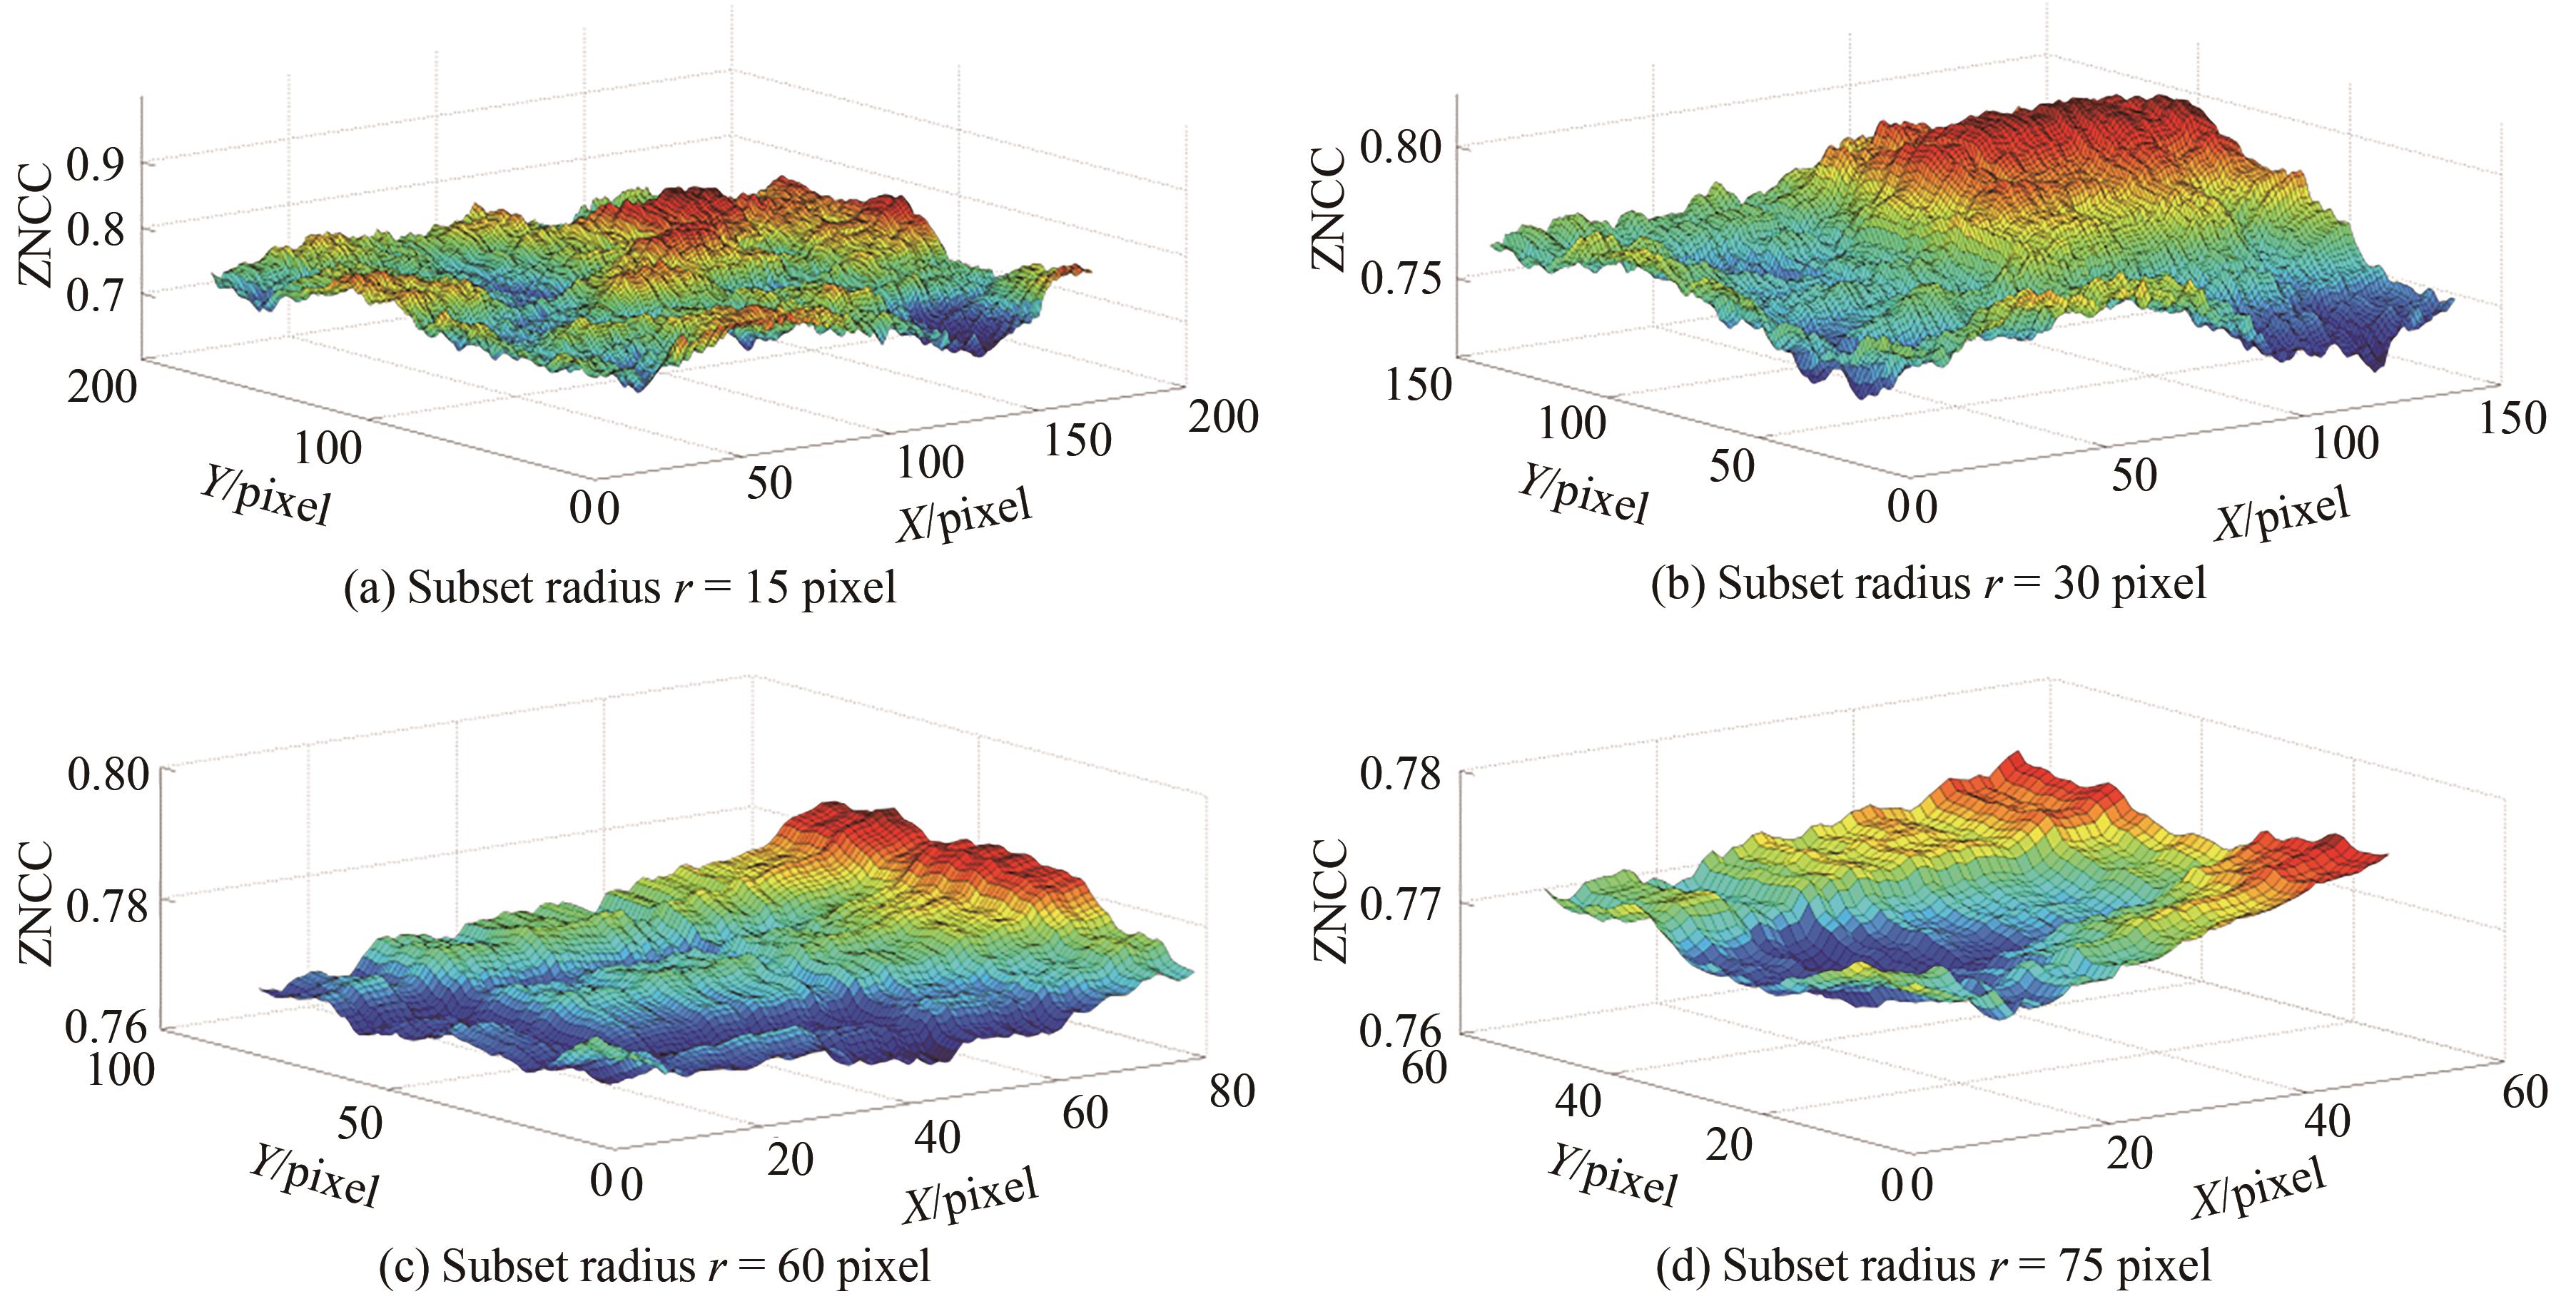
    Fig. 1. Distribution of ZNCC scores between adjacent subsets for different subset radius r
    Speckle patterns and distribution of ZNCC scores between adjacent subsets for different Shannon entropy
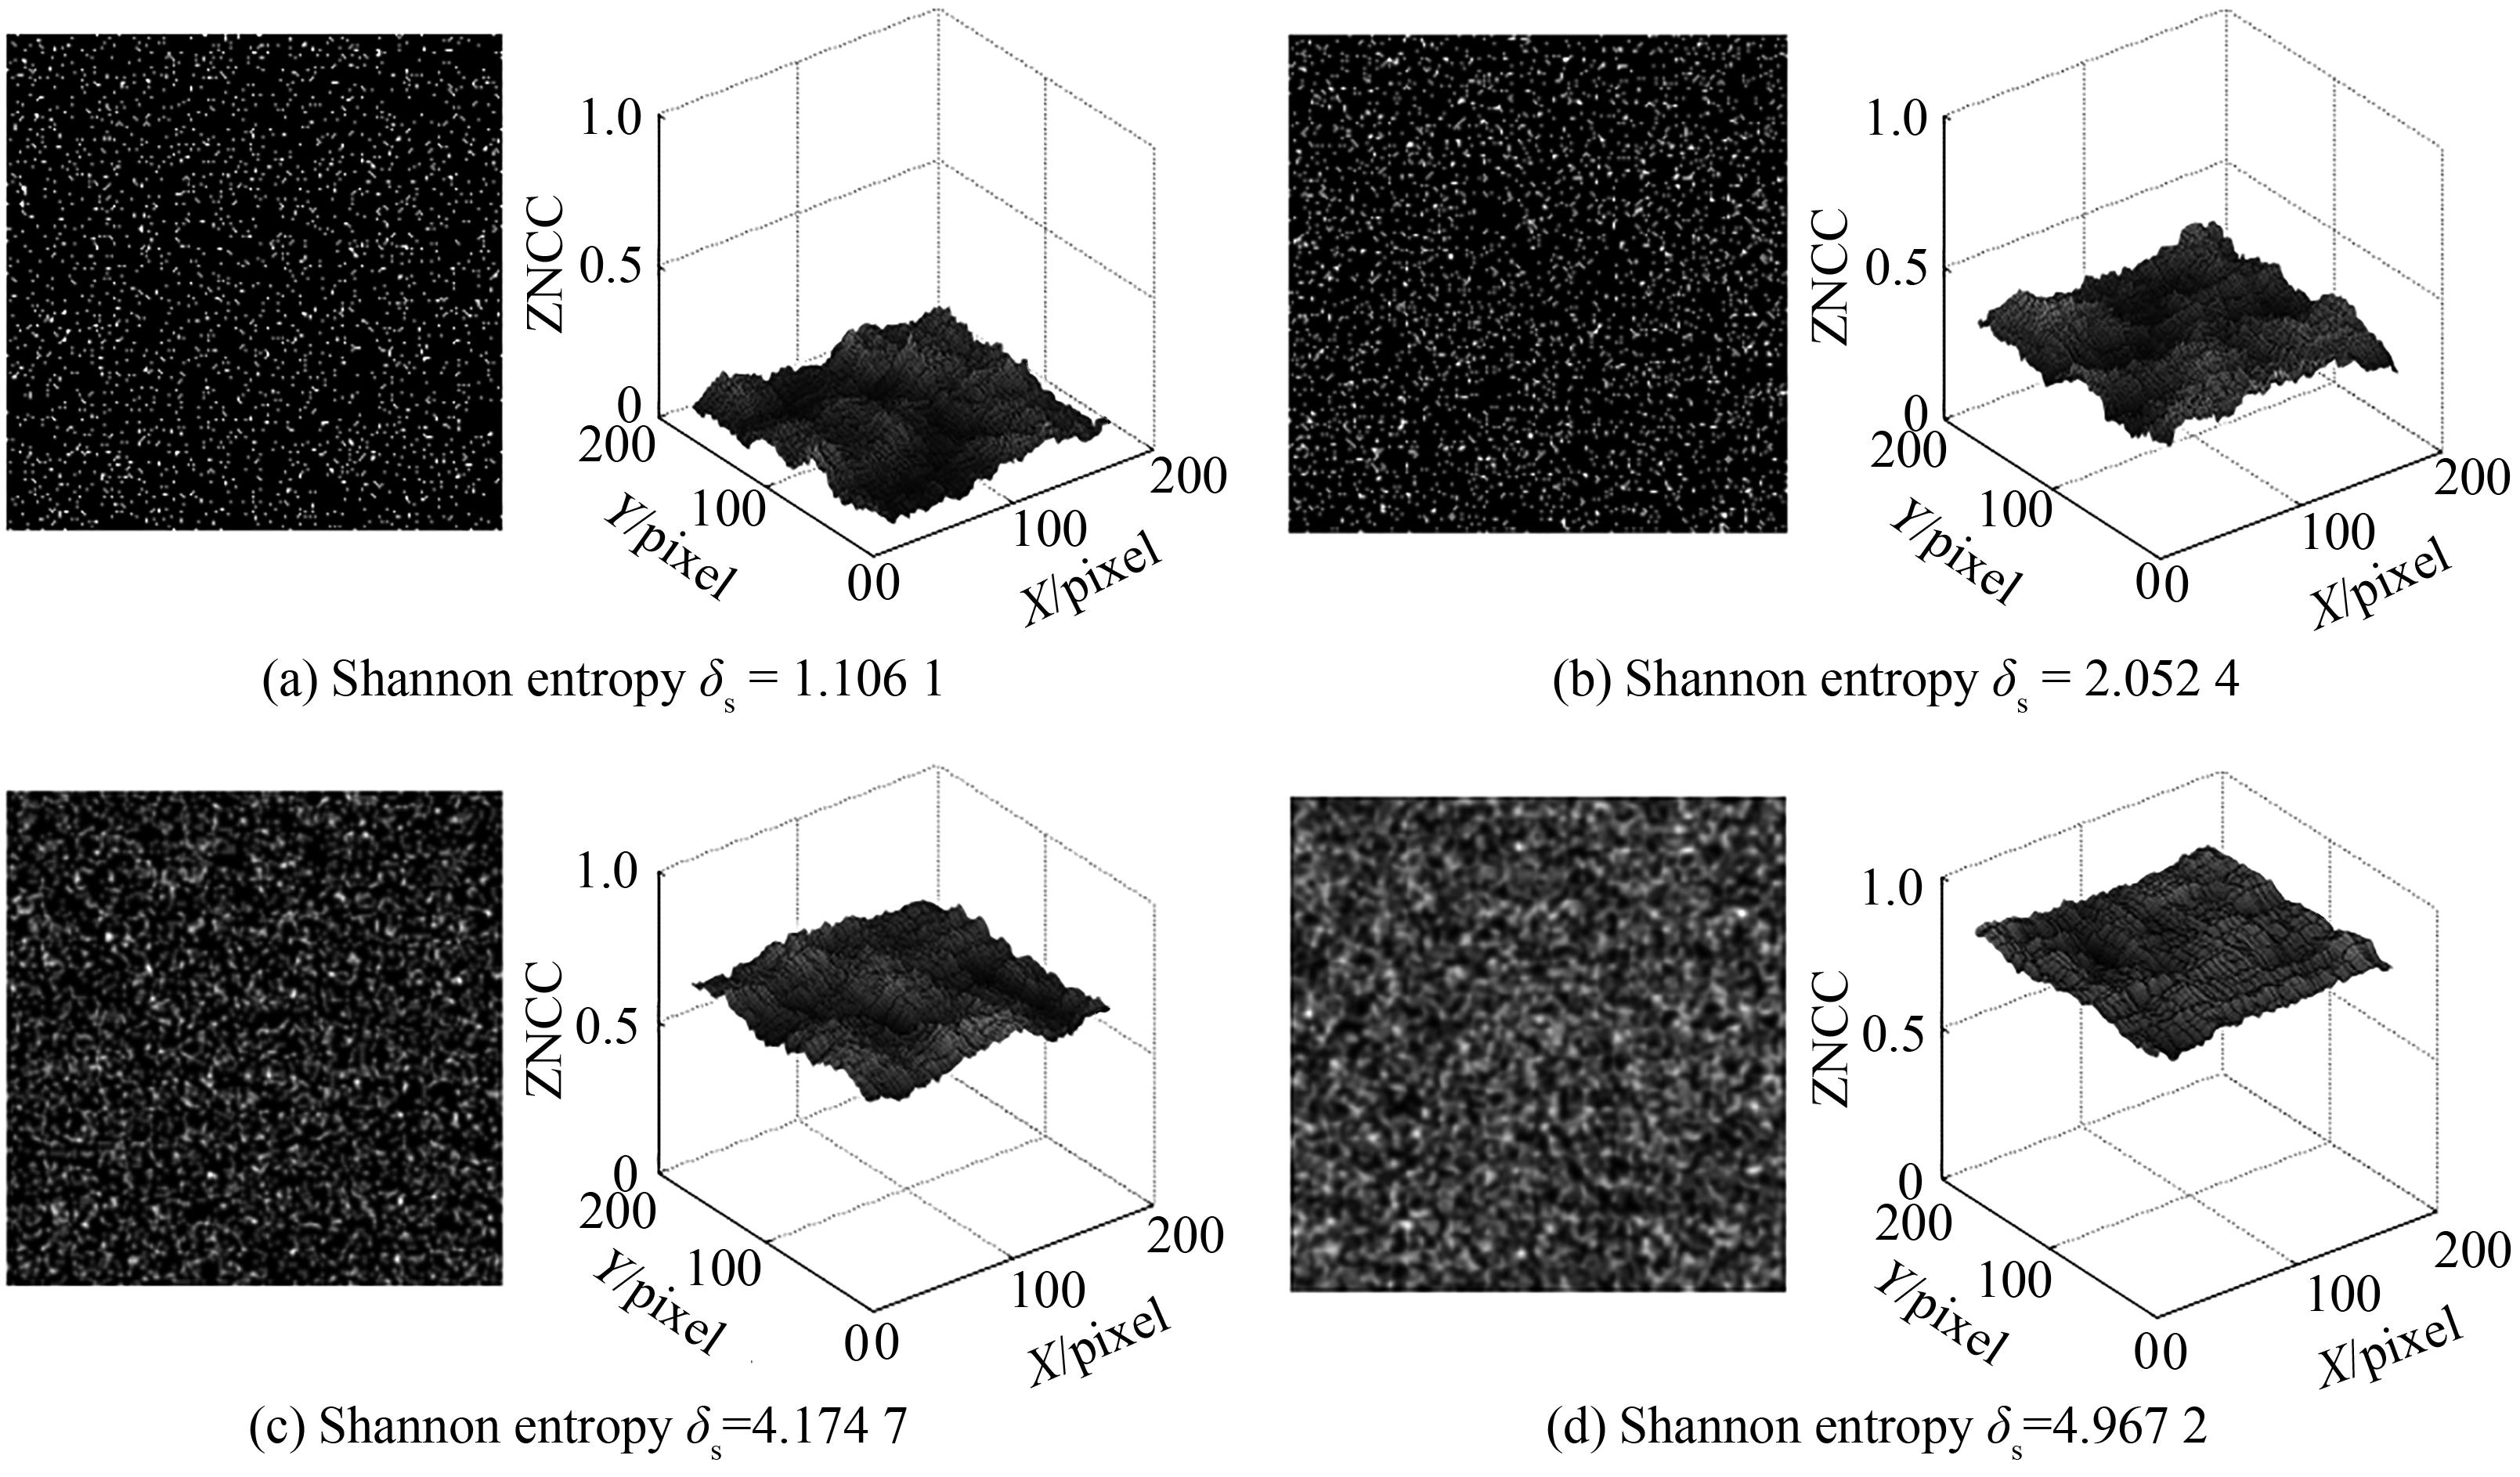
    Fig. 2. Speckle patterns and distribution of ZNCC scores between adjacent subsets for different Shannon entropy
    Graph of relation between δfand δmin speckle pattern
    Fig. 3. Graph of relation between δfand δmin speckle pattern
    Relation between subpixel displacement and mean bias error for speckle patterns of different δm
    Fig. 4. Relation between subpixel displacement and mean bias error for speckle patterns of different δm
    Relation between subpixel displacement and standard deviation for speckle patterns of different δm
    Fig. 5. Relation between subpixel displacement and standard deviation for speckle patterns of different δm
    Simulated speckle patterns in different speckle sizes
    Fig. 6. Simulated speckle patterns in different speckle sizes
    Relation between speckle radius and δm
    Fig. 7. Relation between speckle radius and δm
    Relation between speckle radius and mean bias error
    Fig. 8. Relation between speckle radius and mean bias error
    r15 pixel30 pixel60 pixel75 pixel
    δm0.766 70.770 10.773 20.771 6
    Table 1. δmvalues for different subset radius r
    Sizeδsδfδma/S
    100 pixel×100 pixel5.086 641.433 90.899 02.121 0 pixel/2 000
    150 pixel×150 pixel4.953 938.521 70.901 82.252 0 pixel/1 658
    200 pixel×200 pixel4.419 134.339 50.903 52.236 0 pixel/1 237
    250 pixel×250 pixel4.380 133.776 20.903 02.259 0 pixel/1 817
    300 pixel×300 pixel3.618 125.717 50.901 92.209 0 pixel/1 717
    350 pixel×350 pixel3.392 822.596 60.903 02.192 0 pixel/2 210
    400 pixel×400 pixel3.575 426.254 40.903 42.194 0 pixel/2 982
    450 pixel×450 pixel2.635 518.019 90.899 52.165 0 pixel/2 304
    500 pixel×500 pixel2.069 714.696 40.901 52.191 0 pixel/1 925
    700 pixel×700 pixel1.472 110.715 10.907 12.253 0 pixel/2 223
    1000 pixel×1000 pixel1.259 26.944 70.901 42.194 0 pixel/4 051
    Table 2. Quality assessment parameter values under the same maximum mean error and different sizes
    Xiangbo LI, Jun GONG, Dan HU, Jianwen SONG, Kai LIU. Quality Assessment Method of Speckle Patterns Based on Correlation Coefficient of Adjacent Subsets[J]. Acta Photonica Sinica, 2021, 50(5): 204
    Download Citation