
Miao Qu, Sha Yan. Correction method for pulse energy density of compression plasma flows[J]. High Power Laser and Particle Beams, 2023, 35(6): 065005
- High Power Laser and Particle Beams
- Vol. 35, Issue 6, 065005 (2023)
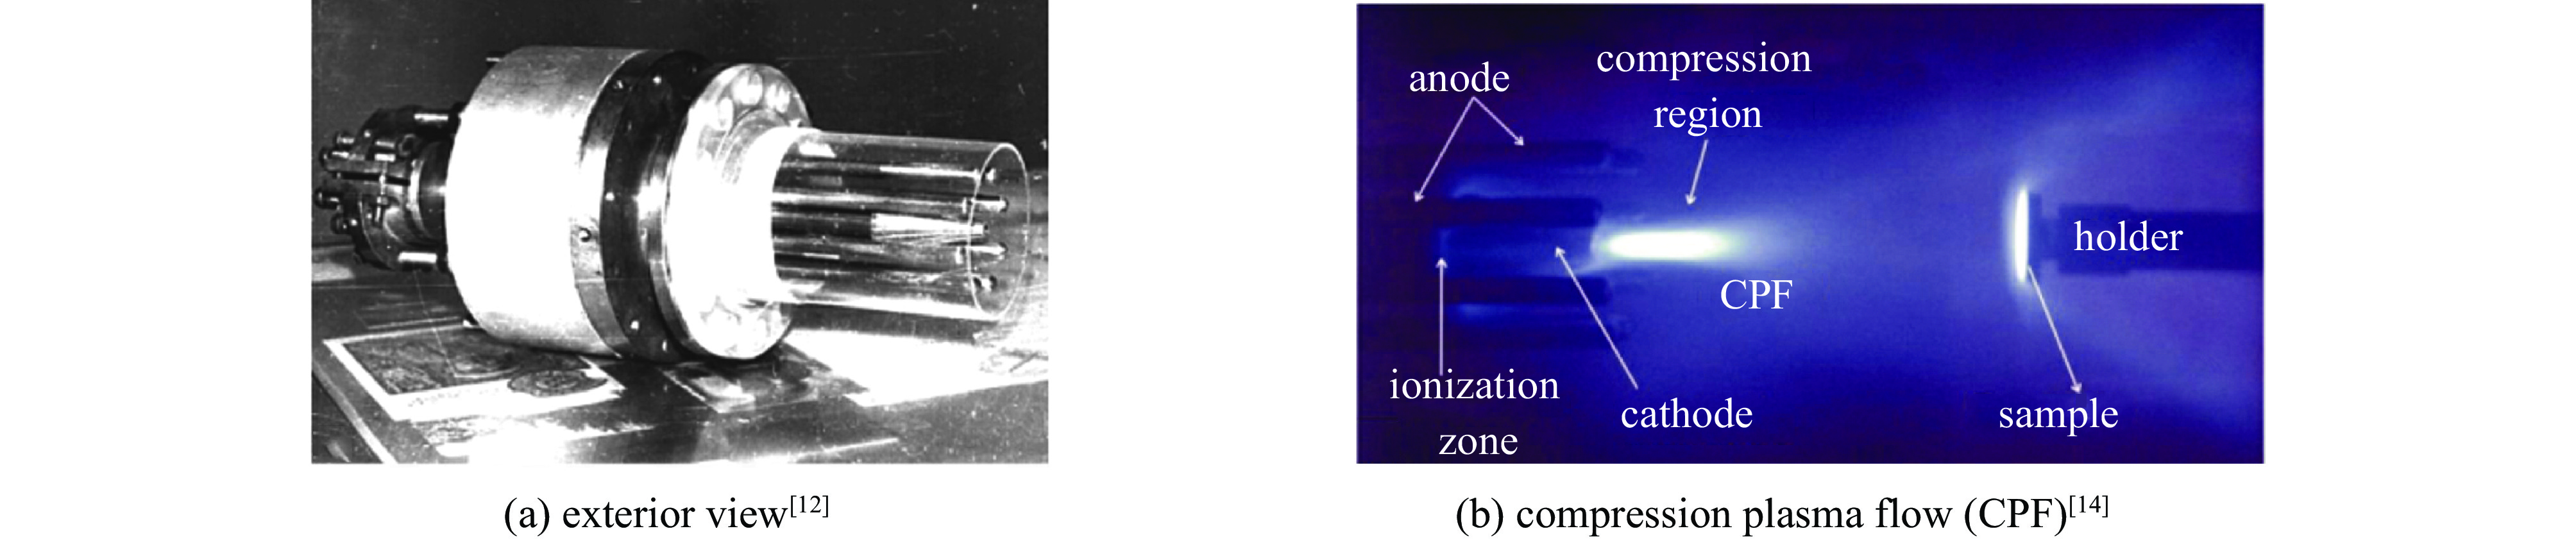
Fig. 1. Compact magnetoplasma compressor and compression plasma flow
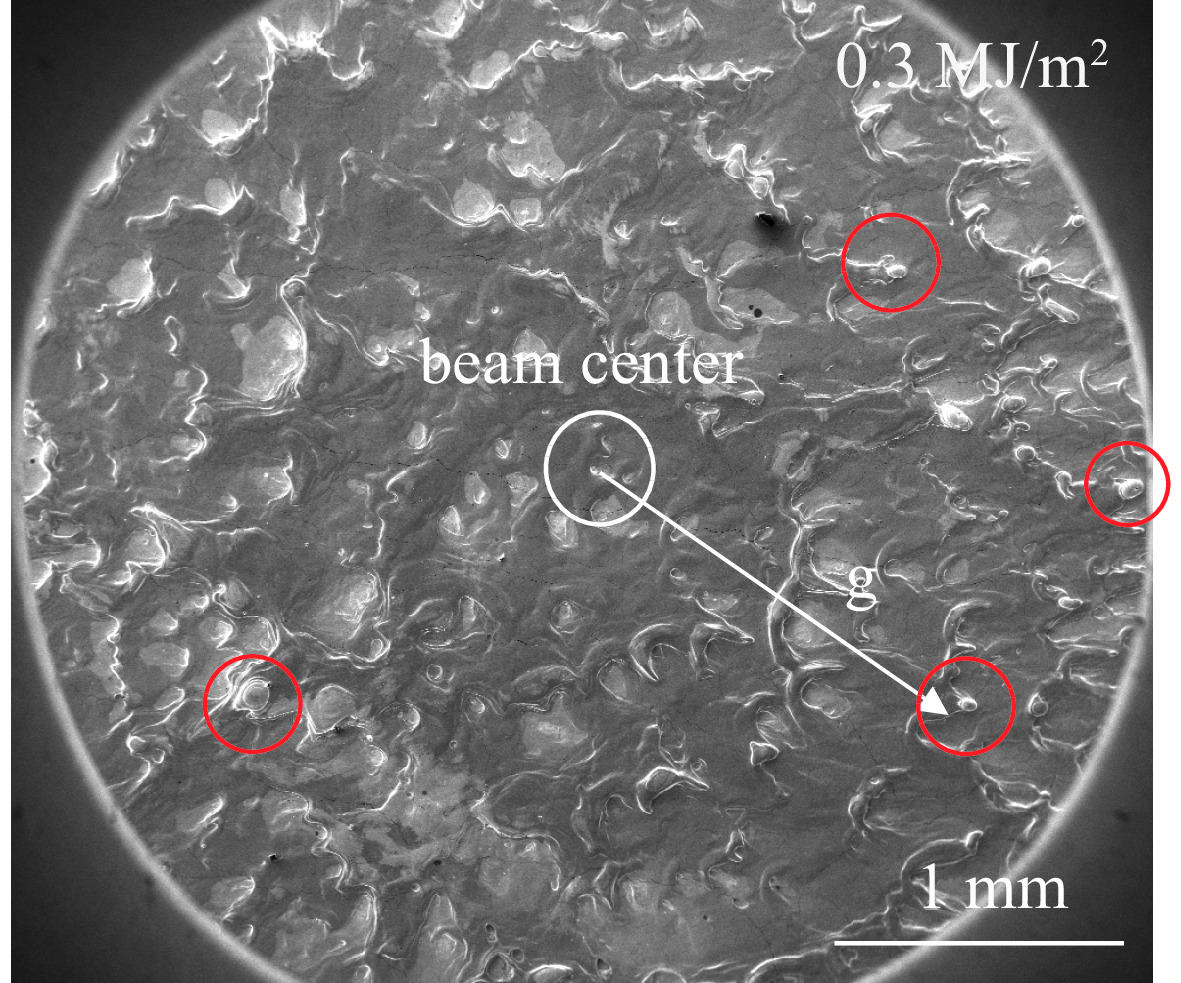
Fig. 2. Surface morphology of tungsten under CPF single pulse irradiation with nominal energy density of 0.3 MJ/m2 (pulse width 0.1 ms)
Fig. 3. Variation of surface temperature with time under different pulse energy densities (pulse width 0.1 ms) calculated by Comsol
Fig. 4. Schematic diagram of energy input and dissipation without boiling and ablation
Fig. 5. Schematic diagram of energy input and dissipation with vaporization or ablation
Fig. 6. Energy density correction method for vaporization process
Fig. 7. Temperature dependence of thermal conductivity of W
Fig. 8. Time dependence of temperature distribution in depth direction of tungsten irradiated by CPF single pulse (pulse width 0.1 ms) with input energy density of 1.2 MJ/m2
Fig. 9. Variation of the calculated surface degeneration with the input energy density
Fig. 10. Variation of mass loss with nominal energy density in experiment
Fig. 11. Degenerative length under different energy densities from Table 2 and Table 3
Fig. 12. Schematic diagram of result evaluation of energy density correction
|
Table 1. Parameters of tungsten materials
|
Table 2. Calculated surface degeneration under different input energy densities
|
Table 3. Surface degeneration corresponding to mass loss in the experiment
|
Table 4. Correction results of nominal average energy densities

Set citation alerts for the article
Please enter your email address
© Copyright 2018-2021 | Chinese Laser Press. All Rights Reserved 沪ICP备15018463号-20