• Chinese Journal of Lasers
  • Vol. 45, Issue 9, 911016 (2018)
Cao Chenpeng, Hao Shiguo, Luo Ningning, Shi Jiulin, and He Xingdao
Author Affiliations
  • [in Chinese]
  • show less
    DOI: 10.3788/CJL201845.0911016 Cite this Article Set citation alerts
    Cao Chenpeng, Hao Shiguo, Luo Ningning, Shi Jiulin, He Xingdao. Authentication and Analysis of Olive Oil Based on Stimulated Brillouin Scattering and UV-Visible Absorption Spectrum[J]. Chinese Journal of Lasers, 2018, 45(9): 911016 Copy Citation Text show less
    Schematic diagram of stimulated Brillouin scattering. (a) Optical schematic; (b) acquisition system based on F-P etalon and ICCD camera
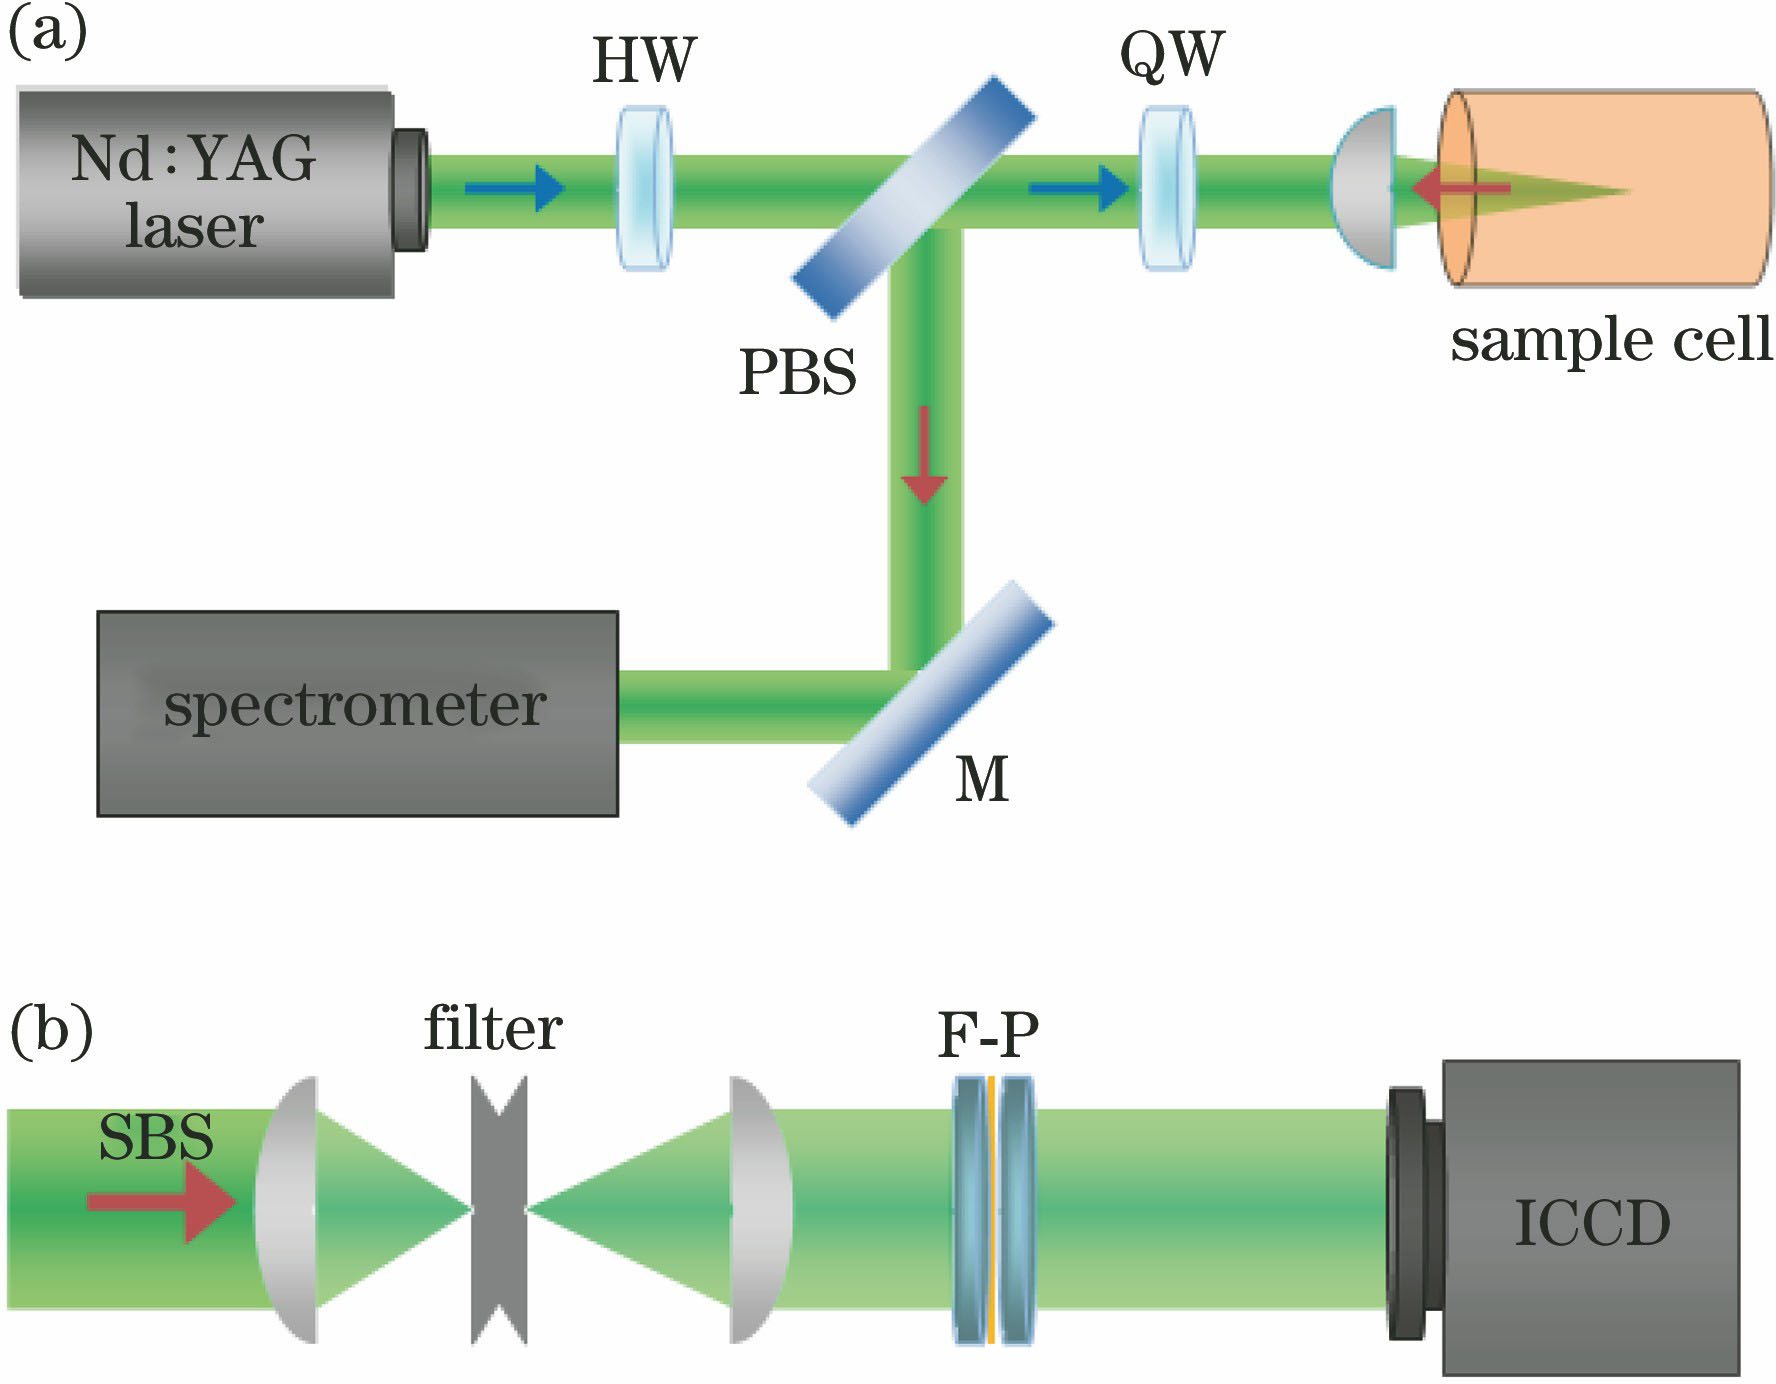
    Fig. 1. Schematic diagram of stimulated Brillouin scattering. (a) Optical schematic; (b) acquisition system based on F-P etalon and ICCD camera
    Near UV-visible absorption spectra of nine kinds of olive oils
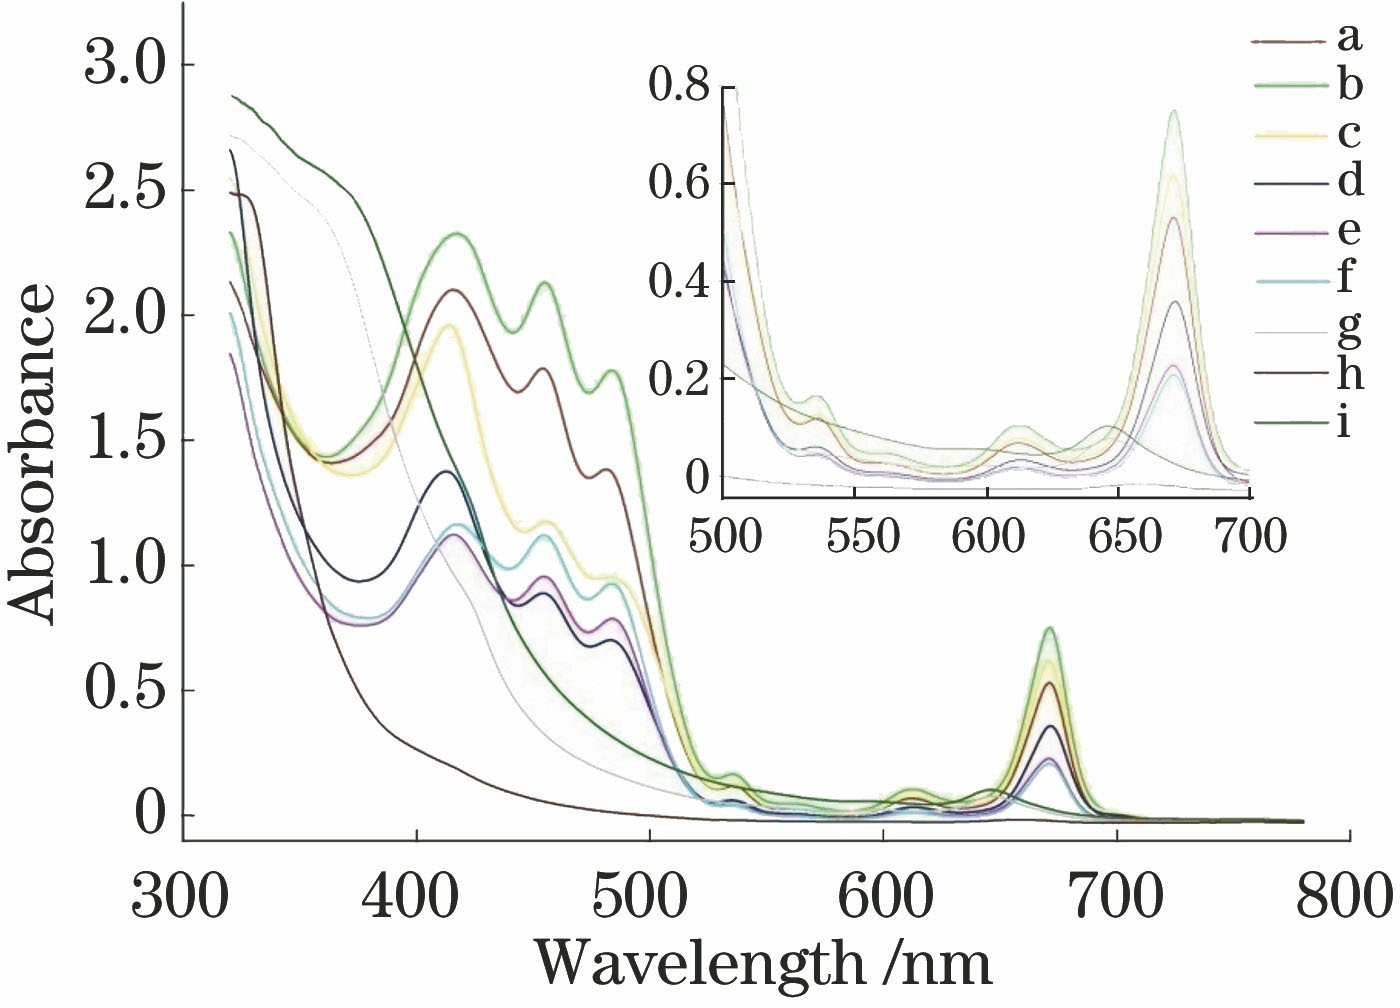
    Fig. 2. Near UV-visible absorption spectra of nine kinds of olive oils
    Near UV-visible absorption spectra of different classes of olive oils
    Fig. 3. Near UV-visible absorption spectra of different classes of olive oils
    Near UV-visible absorption spectra of mixed olive oils
    Fig. 4. Near UV-visible absorption spectra of mixed olive oils
    Typical stimulated Brillouin scattering spectrum
    Fig. 5. Typical stimulated Brillouin scattering spectrum
    Stimulated Brillouin scattering spectra of different classes of olive oils. (a) Extra virgin olive oil; (b) pomace olive oil; (c) refined olive oil; (d) medium-grade virgin olive oil
    Fig. 6. Stimulated Brillouin scattering spectra of different classes of olive oils. (a) Extra virgin olive oil; (b) pomace olive oil; (c) refined olive oil; (d) medium-grade virgin olive oil
    Stimulated Brillouin scattering frequency shift vs temperature for different classes of olive oils
    Fig. 7. Stimulated Brillouin scattering frequency shift vs temperature for different classes of olive oils
    SpectralcurveVolume fraction ofpomace olive oil /%Volume fraction ofextra virgin olive oil /%
    Curve 10100
    Curve 25050
    Curve 366.6733.33
    Curve 47525
    Curve 58020
    Curve 683.3316.67
    Curve 785.7114.29
    Curve 887.5012.50
    Curve 988.8911.11
    Curve 109010
    Curve 1190.919.09
    Curve 1291.678.33
    Curve 1392.317.69
    Curve 1492.867.69
    Curve 1593.336.67
    Curve 1693.756.25
    Curve 1794.125.88
    Curve 1894.445.56
    Curve 1995.244.76
    Curve 201000
    Table 1. Volume fraction of pomace olive oil and extra virgin olive oil in mixed olive oils
    Olive oilEquation
    Extra virgin olive oilVE=8.2970+13.9241exp(-0.1132T)
    Medium-gradevirgin olive oilVM=8.2652+24.2861exp(-0.1402T)
    Refine dolive oilVR=8.0918+4.5401exp(-0.0478T)
    Pomace olive oilVP=8.2294+6.1423exp(-0.0705T)
    Table 2. Empirical equation for relation between stimulated Brillouin scattering frequency shift of different classes of olive oils and temperature
    Cao Chenpeng, Hao Shiguo, Luo Ningning, Shi Jiulin, He Xingdao. Authentication and Analysis of Olive Oil Based on Stimulated Brillouin Scattering and UV-Visible Absorption Spectrum[J]. Chinese Journal of Lasers, 2018, 45(9): 911016
    Download Citation