• Acta Physica Sinica
  • Vol. 69, Issue 16, 168703-1 (2020)
Dan-Ying Lin*, Jing-Jing Niu, Xiong-Bo Liu, Xiao Zhang, Jiao Zhang, Bin Yu, and Jun-Le Qu*
Author Affiliations
  • Key Laboratory of Optoelectronic Devices and Systems of Ministry of Education and Guangdong Province, College of Physics and Optoelectronic Engineering, Shenzhen University, Shenzhen 518060, China
  • show less
    DOI: 10.7498/aps.69.20200554 Cite this Article
    Dan-Ying Lin, Jing-Jing Niu, Xiong-Bo Liu, Xiao Zhang, Jiao Zhang, Bin Yu, Jun-Le Qu. Phasor analysis of fluorescence lifetime data and its application[J]. Acta Physica Sinica, 2020, 69(16): 168703-1 Copy Citation Text show less
    Schematic diagram of fluorescence lifetime measurement and phasor analysis (PA):(a) Frequency domain method; (b) lifetime phasor of single-exponential decay; (c) lifetime phasor of bi-exponential decay; (d) time-correlated single photon counting (TCSPC) method.
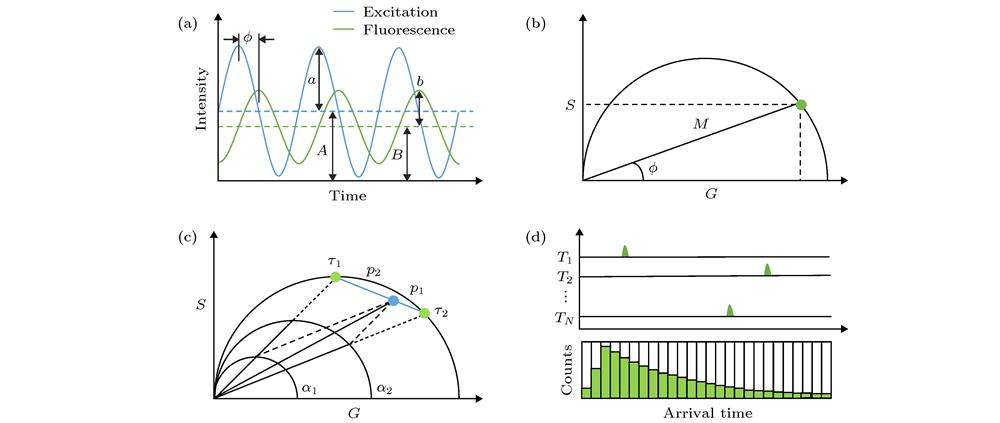
    Fig. 1. Schematic diagram of fluorescence lifetime measurement and phasor analysis (PA):(a) Frequency domain method; (b) lifetime phasor of single-exponential decay; (c) lifetime phasor of bi-exponential decay; (d) time-correlated single photon counting (TCSPC) method.
    Schematic diagram of phasor-FLIM application:(a) Fluorescence intensity image with untreated lifetime information; (b) lifetime phasor plot obtained by PA analysis; (c) direct analysis of lifetime phasors; (d) phasor-mapped FLIM image based on phasor clustering analysis and pseudo-color assignment.
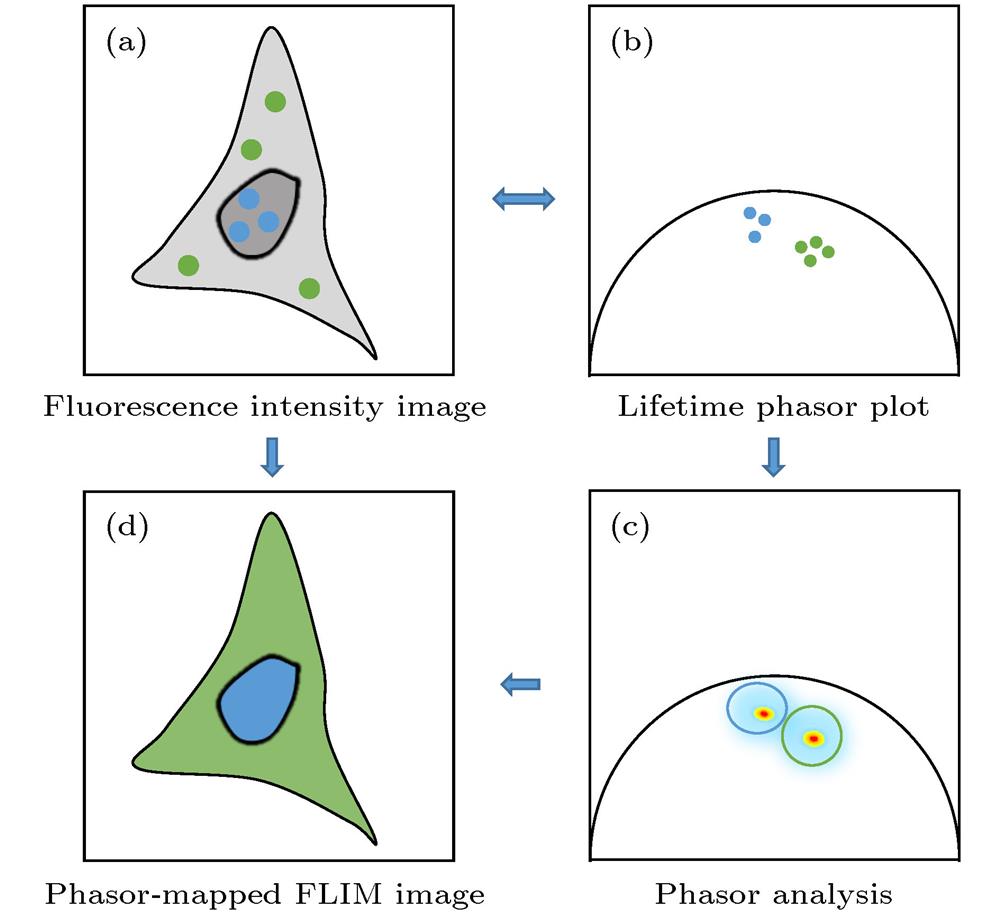
    Fig. 2. Schematic diagram of phasor-FLIM application:(a) Fluorescence intensity image with untreated lifetime information; (b) lifetime phasor plot obtained by PA analysis; (c) direct analysis of lifetime phasors; (d) phasor-mapped FLIM image based on phasor clustering analysis and pseudo-color assignment.
    Application classification diagram of phasor-FLIM.
    Fig. 3. Application classification diagram of phasor-FLIM.
    Phasor-FLIM was used to analyze the change of NADH/NAD+ ratio under the stimulation of hypoxia and mitochondrial toxic drug potassium cyanide, for studying the change of metabolic state of cells[27].
    Fig. 4. Phasor-FLIM was used to analyze the change of NADH/NAD+ ratio under the stimulation of hypoxia and mitochondrial toxic drug potassium cyanide, for studying the change of metabolic state of cells[27].
    Phasor-FLIM was used in quantitative FRET efficiency detection of a RhoA-kRas single chain biosensor, studying interaction between proteins[28].
    Fig. 5. Phasor-FLIM was used in quantitative FRET efficiency detection of a RhoA-kRas single chain biosensor, studying interaction between proteins[28].
    Phasor-FLIM was used to analyze the changes of pH value of cells in normal state (at rest) and under oxidative stress[32].
    Fig. 6. Phasor-FLIM was used to analyze the changes of pH value of cells in normal state (at rest) and under oxidative stress[32].
    Phasor-FLIM clustering analysis and pseudo-color assignment was used to enhance visualization of pathological features of basal cell carcinoma (BCC) sections stained with H&E, assisting pathological diagnosis[36].
    Fig. 7. Phasor-FLIM clustering analysis and pseudo-color assignment was used to enhance visualization of pathological features of basal cell carcinoma (BCC) sections stained with H&E, assisting pathological diagnosis[36].
    Phasor-FLIM cluster analysis was used to filter out the photons in the annular depletion region in stimulated radiation depletion (STED) imaging, improving the resolution of super-resolution imaging[39].
    Fig. 8. Phasor-FLIM cluster analysis was used to filter out the photons in the annular depletion region in stimulated radiation depletion (STED) imaging, improving the resolution of super-resolution imaging[39].
    Dan-Ying Lin, Jing-Jing Niu, Xiong-Bo Liu, Xiao Zhang, Jiao Zhang, Bin Yu, Jun-Le Qu. Phasor analysis of fluorescence lifetime data and its application[J]. Acta Physica Sinica, 2020, 69(16): 168703-1
    Download Citation