• Chinese Physics B
  • Vol. 29, Issue 8, (2020)
Jie Liu, Jianzhong Fan, Kai Zhang, Yuchen Zhang, Chuan-Kui Wang, and Lili Lin
Author Affiliations
  • Key Laboratory of Medical Physics and Image Processing & Shandong Provincial Engineering and Technical Center of Light Manipulations, School of Physics and Electronics, Shandong Normal University, Jinan 250358, China
  • show less
    DOI: 10.1088/1674-1056/aba2d9 Cite this Article
    Jie Liu, Jianzhong Fan, Kai Zhang, Yuchen Zhang, Chuan-Kui Wang, Lili Lin. Perspective for aggregation-induced delayed fluorescence mechanism: A QM/MM study[J]. Chinese Physics B, 2020, 29(8): Copy Citation Text show less
    (a) Chemical structure of DMF-BP-DMAC. (b) The atomic labels and the interesting bond lengths (B1, B2), bond angles (θ1, θ2), and dihedral angles (α1, α2, α3, and α4). (c) ONIOM model: surrounding molecules are regarded as low layer and the centered DMF-BP-DMAC is treated as high layer.
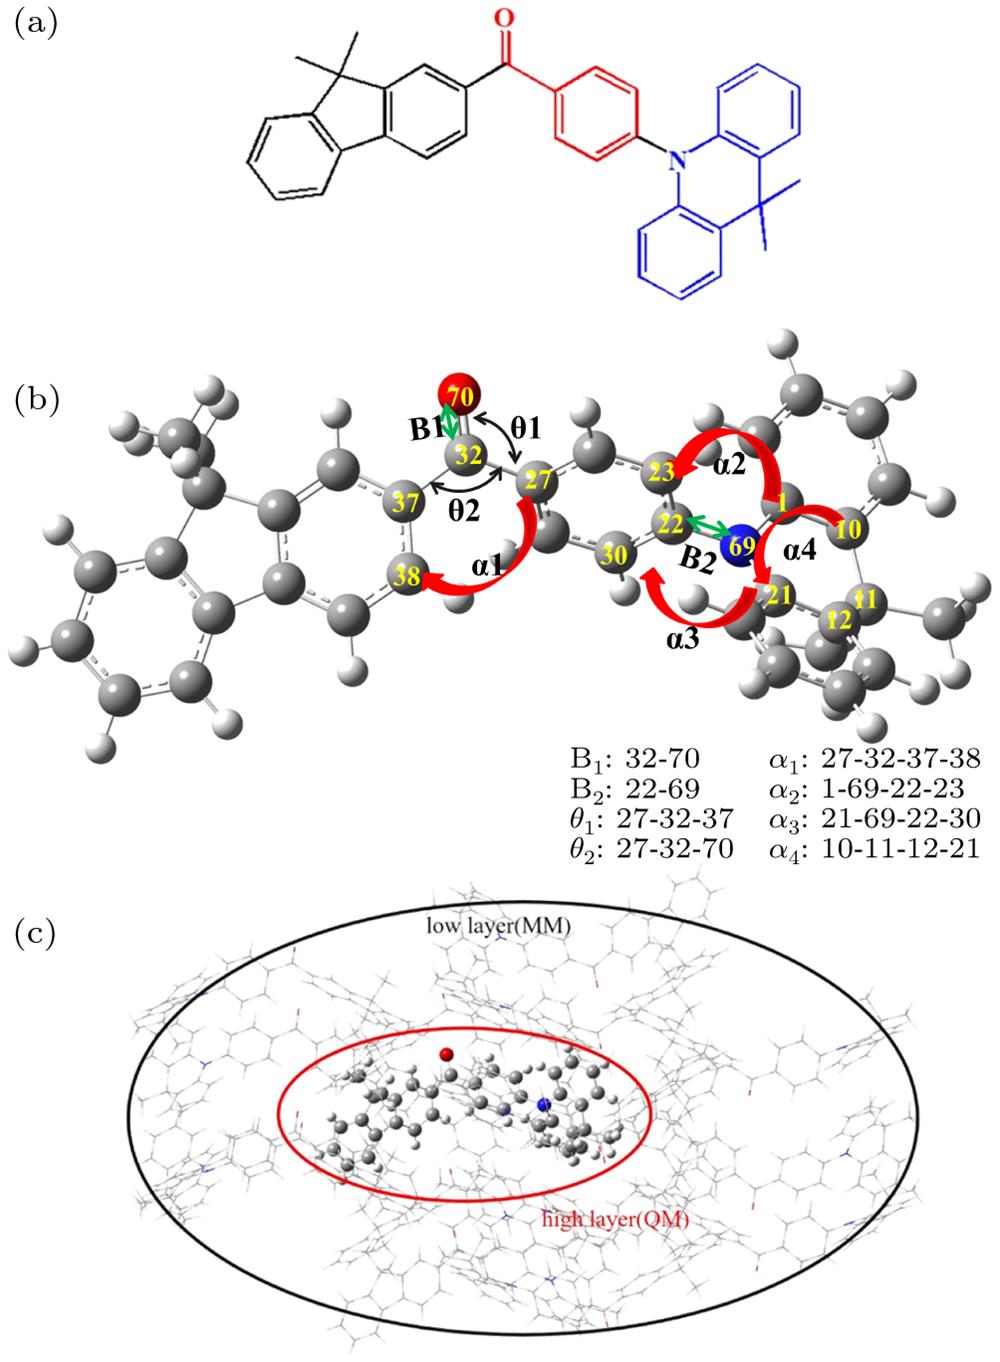
    Fig. 1. (a) Chemical structure of DMF-BP-DMAC. (b) The atomic labels and the interesting bond lengths (B1, B2), bond angles (θ1, θ2), and dihedral angles (α1, α2, α3, and α4). (c) ONIOM model: surrounding molecules are regarded as low layer and the centered DMF-BP-DMAC is treated as high layer.
    Geometry changes between two selected states for DMF-BP-DMAC in THF (a) and solid phase (b).
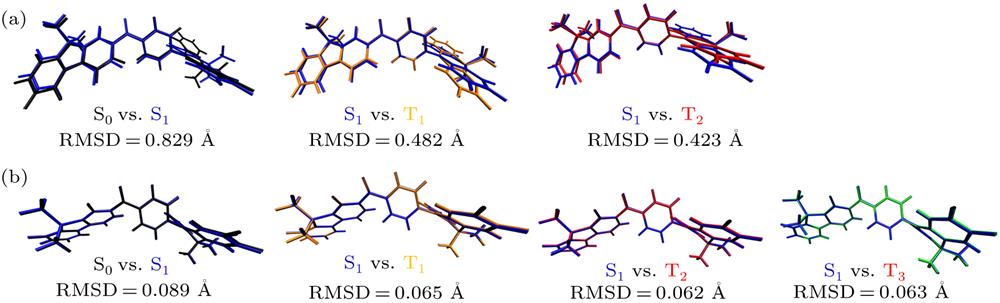
    Fig. 2. Geometry changes between two selected states for DMF-BP-DMAC in THF (a) and solid phase (b).
    Energy levels and distributions of HOMO and LUMO for molecule in THF and solid phase (isovalue = 0.02).
    Fig. 3. Energy levels and distributions of HOMO and LUMO for molecule in THF and solid phase (isovalue = 0.02).
    Adiabatic excitation energies for DMF-BP-DMAC in THF (a) and solid phase (b).
    Fig. 4. Adiabatic excitation energies for DMF-BP-DMAC in THF (a) and solid phase (b).
    Transition characteristics for S1, T1, and T2 of DMF-BP-DMAC in THF (a) and transition characteristics for S1, T1, T2, and T3 of DMF-BP-DMAC in solid phase (b) (isovalue = 0.02). The value below every arrow represents the component of localized excitation in the corresponding transition.
    Fig. 5. Transition characteristics for S1, T1, and T2 of DMF-BP-DMAC in THF (a) and transition characteristics for S1, T1, T2, and T3 of DMF-BP-DMAC in solid phase (b) (isovalue = 0.02). The value below every arrow represents the component of localized excitation in the corresponding transition.
    The calculated HR factors of DMF-BP-DMAC in THF (a) and solid phase (b). The corresponding vibration modes are shown in inset.
    Fig. 6. The calculated HR factors of DMF-BP-DMAC in THF (a) and solid phase (b). The corresponding vibration modes are shown in inset.
    THFSolid
    λ/nmfλ/nmf
    B3LYP5900.00015610.0068
    PBE05420.00015170.0089
    BMK4470.00064300.0176
    M062X3940.02233960.0055
    Exp.a534510
    Table 1. Emission wavelength and oscillator strength calculated by different functionals for DMF-BP-DMAC in tetrahydrofuran (THF) and solid phase.
    THFSolid
    S0S1T1T2S0S1T1T2T3
    B11.231.271.271.271.221.261.261.251.25
    B21.431.441.431.431.421.451.441.441.44
    θ1120.39121.71121.88121.71119.17119.01119.50120.26120.24
    θ2119.27120.20119.92120.17119.96120.58120.38120.05120.05
    α127.6232.4232.8833.71−40.28−40.62−41.10−34.94−34.98
    α2−79.38−89.98−67.94−110.4975.9983.6075.7978.0377.98
    α381.24−91.10−69.22−111.0984.5381.0473.3779.4879.42
    α439.060.20−1.882.51−38.53−33.84−34.64−36.44−36.52
    Table 2. Geometry parameters of S0, S1, T1, and T2 states for DMF-BP-DMAC in THF and those of S0, S1, T1, T2, and T3 states for DMF-BP-DMAC in solid phase. Bond lengths (B1, B2), bond angles (θ1, θ2), and dihedral angles (α1, α2, α3, α4) are marked in Fig. 1(b).
    SOCa/cm−1SOCb/cm−1λS/meVλT/meVΔE/meVKISC/s−1KRISC/s−1
    THFS1–T10.010.44124.215.624.11.98 × 1051.87 × 1010
    S1–T20.671.84106.4421.117.64.14 × 1066.57 × 108
    S1–T30.330.34271.5292.3-419.42.51 × 1072.5
    SolidS1–T10.190.3952.124.547.74.81 × 1072.68 × 107
    S1–T20.380.44148.3225.4-146.52.00 × 1051.30 × 108
    S1–T30.600.81148.5510.3-146.53.47 × 1044.40 × 108
    Table 3. Spin–orbit coupling (SOC), reorganization energy (λ), energy difference (ΔE), intersystem crossing rates (KISC), and reverse intersystem crossing rates (KRISC) between single excited states and triplet excited states.
    THFSolid
    Kr/s−12.27 × 1042.29 × 106
    2.18 × 1074.79 × 107
    1.81 × 10104.25 × 108
    Table 4. Calculated radiative rate (Kr), effective intersystem crossing rates (KISCCal), and effective reverse intersystem crossing rates (KRISCCal).
    Jie Liu, Jianzhong Fan, Kai Zhang, Yuchen Zhang, Chuan-Kui Wang, Lili Lin. Perspective for aggregation-induced delayed fluorescence mechanism: A QM/MM study[J]. Chinese Physics B, 2020, 29(8):
    Download Citation