• Journal of Geo-information Science
  • Vol. 22, Issue 10, 1935 (2020)
Tianlin HONG1, Yunmei LI1、*, Heng LV1, Bin MENG2, Sun BI1, and Ling ZHOU1
Author Affiliations
  • 1Key Laboratory of Virtual Geographic Environment of Education Ministry, Nanjing Normal University, Nanjing 210023, China
  • 2Ministry of Ecology and Environment Center of Satellite Application on Ecology and Environment, Beijing 100094, China
  • show less
    DOI: 10.12082/dqxxkx.2020.200206 Cite this Article
    Tianlin HONG, Yunmei LI, Heng LV, Bin MENG, Sun BI, Ling ZHOU. Patterns of Phytoplankton Phenology and Its Response to Temperature of Water Surface in Lake Taihu based on MODIS Data[J]. Journal of Geo-information Science, 2020, 22(10): 1935 Copy Citation Text show less
    Geographical location and in-situ samples of Lake Taihu
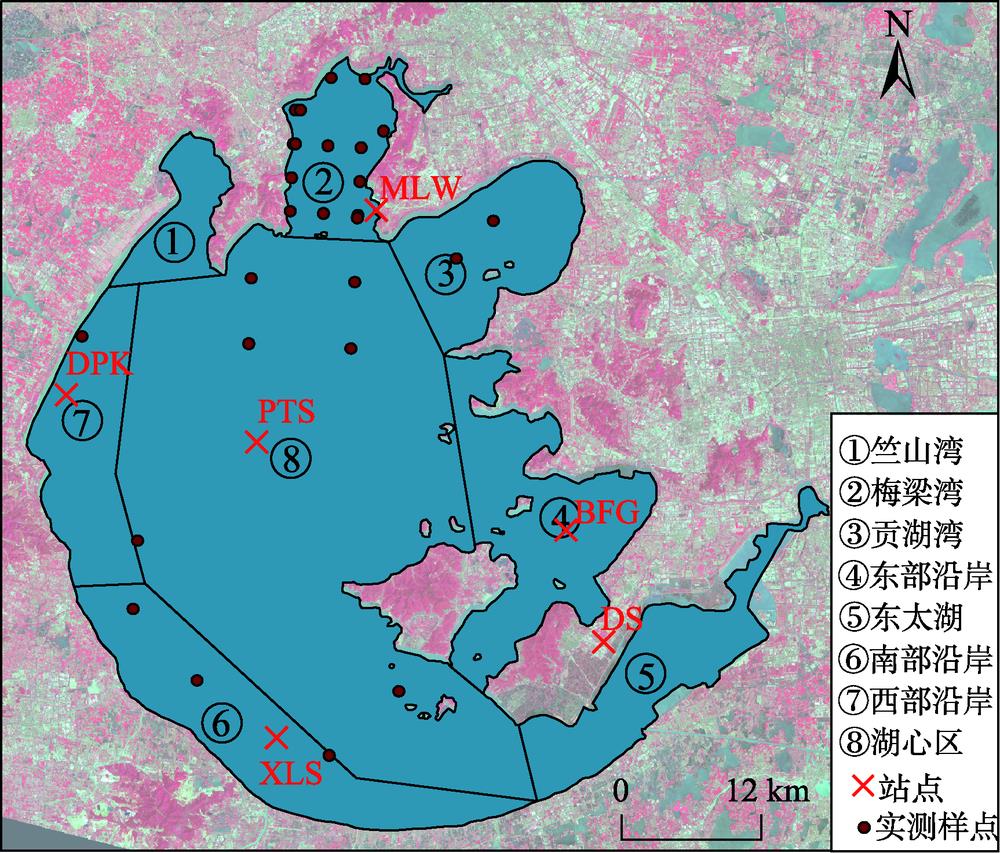
    Fig. 1. Geographical location and in-situ samples of Lake Taihu
    Calculation of phytoplankton phenology metrics
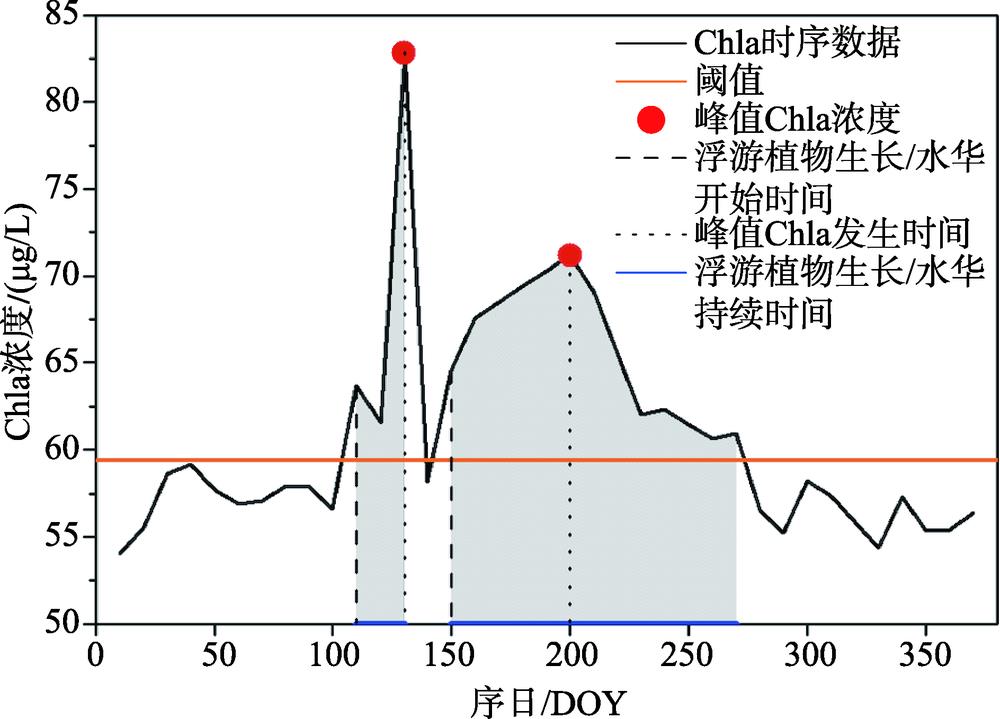
    Fig. 2. Calculation of phytoplankton phenology metrics
    Spatial distribution of the number of blooms in Lake Taihu from 2003 to 2018
    Fig. 3. Spatial distribution of the number of blooms in Lake Taihu from 2003 to 2018
    Spatial distribution of phytoplankton growth start date in Lake Taihu from 2003 to 2018
    Fig. 4. Spatial distribution of phytoplankton growth start date in Lake Taihu from 2003 to 2018
    Spatial distribution of bloom start date in Lake Taihu from 2003 to 2018
    Fig. 5. Spatial distribution of bloom start date in Lake Taihu from 2003 to 2018
    Spatial distribution of chla concentration peak in Lake Taihu from 2003 to 2018
    Fig. 6. Spatial distribution of chla concentration peak in Lake Taihu from 2003 to 2018
    Spatial distribution of average bloom duration in Lake Taihu from 2003 to 2018
    Fig. 7. Spatial distribution of average bloom duration in Lake Taihu from 2003 to 2018
    Spatial distribution of total bloom duration in Lake Taihu from 2003 to 2018
    Fig. 8. Spatial distribution of total bloom duration in Lake Taihu from 2003 to 2018
    Regional division of Lake Taihu based on phytoplankton phenology metrics from 2003 to 2018
    Fig. 9. Regional division of Lake Taihu based on phytoplankton phenology metrics from 2003 to 2018
    Box plots of different phytoplankton phenology metrics in various regions of Lake Taihu (blooming events)
    Fig. 10. Box plots of different phytoplankton phenology metrics in various regions of Lake Taihu (blooming events)
    Box plots of different phytoplankton phenology metrics in various regions of Lake Taihu (non-blooming events)
    Fig. 11. Box plots of different phytoplankton phenology metrics in various regions of Lake Taihu (non-blooming events)
    Line chart of three phenology metrics (phytoplankton growth start date, peak Chla occurrence date, Chla concentration peak) and corresponding mean LSWT from 2003 to 2018
    Fig. 12. Line chart of three phenology metrics (phytoplankton growth start date, peak Chla occurrence date, Chla concentration peak) and corresponding mean LSWT from 2003 to 2018
    Bloom start date and peak Chla occurrence time under LSWT from 2003 to 2018 (blooming events)
    Fig. 13. Bloom start date and peak Chla occurrence time under LSWT from 2003 to 2018 (blooming events)
    Phytoplankton growth start time and peak Chla occurrence time under LSWT from 2003 to 2018 (non-blooming events)
    Fig. 14. Phytoplankton growth start time and peak Chla occurrence time under LSWT from 2003 to 2018 (non-blooming events)
    Tianlin HONG, Yunmei LI, Heng LV, Bin MENG, Sun BI, Ling ZHOU. Patterns of Phytoplankton Phenology and Its Response to Temperature of Water Surface in Lake Taihu based on MODIS Data[J]. Journal of Geo-information Science, 2020, 22(10): 1935
    Download Citation