
Yu FAN, Huiqin WANG, Ke WANG, Zhan WANG, Gang ZHEN. Multi-output Least-squares SVR Spectral Reflectance Reconstruction Method Based on Adaptive Optimization in Multi-scene[J]. Acta Photonica Sinica, 2022, 51(2): 0230003
- Acta Photonica Sinica
- Vol. 51, Issue 2, 0230003 (2022)
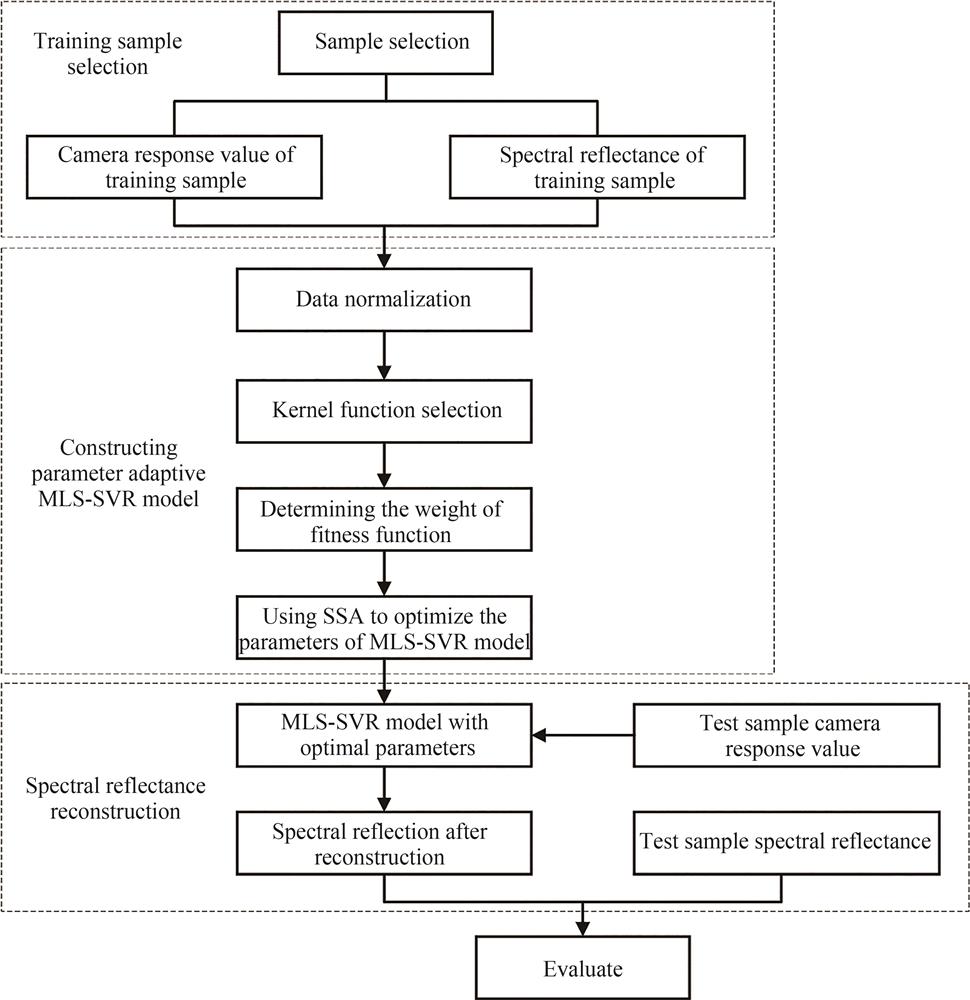
Fig. 1. Structure diagram of MLS-SVR parameters adaptive optimization spectral reconstruction algorithm
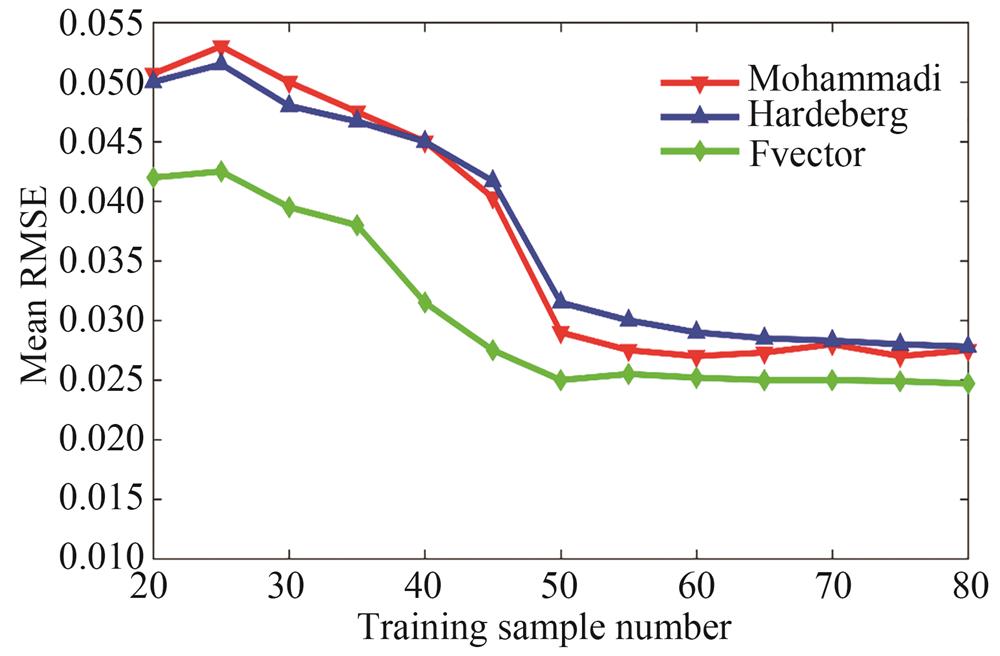
Fig. 2. The relationship between the number of training samples and the average spectral error
Fig. 3. Comparative test sample RMSE
Fig. 4. Spectral reflectance curves of four reconstruction methods
Fig. 5. Color block markers for murals and painted cultural relics
Fig. 6. Schematic diagram of working mode of optical fiber spectrometer and multispectral imaging system
Fig. 7. Schematic diagram of corresponding acquisition area between optical fiber spectrometer and multispectral imaging system
Fig. 8. Flow chart of spectral reconstruction
Fig. 9. Relationship between the number of mixed training samples and the average spectral error
Fig. 10. Relationship between adaptive weight k1 and average spectral error
Fig. 11. Comparison of reconstructed spectral curve and real spectral curve of reference color block
Fig. 12. The chromaticity distribution space of CIELAB reconstructed from reference color block by each reconstruction method
| ||||||||||||||||||||||||||||||||||||||||||||||||||||||||||
Table 1. Accuracy comparison of four spectral reconstruction methods
| |||||||||||||||||||||||||||||||||||||||||||||||||||||||||||||||||||||||||||||||||||||||||||||||||||||||
Table 2. Spectral reflectance reconstruction evaluation of 5 reference color blocks
| ||||||||||||||||||||||||||||||||||||||||
Table 3. Comparison of color restoration of reference color blocks reconstructed by different reconstruction methods

Set citation alerts for the article
Please enter your email address
© Copyright 2018-2021 | Chinese Laser Press. All Rights Reserved 沪ICP备15018463号-20