
Xiang-Bing Wang, Guang-Yue Hu, Zhi-Meng Zhang, Yu-Qiu Gu, Bin Zhao, Yang Zuo, Jian Zheng, "Gamma-ray generation from ultraintense laser-irradiated solid targets with preplasma," High Power Laser Sci. Eng. 8, 04000e34 (2020)
- High Power Laser Science and Engineering
- Vol. 8, Issue 4, 04000e34 (2020)
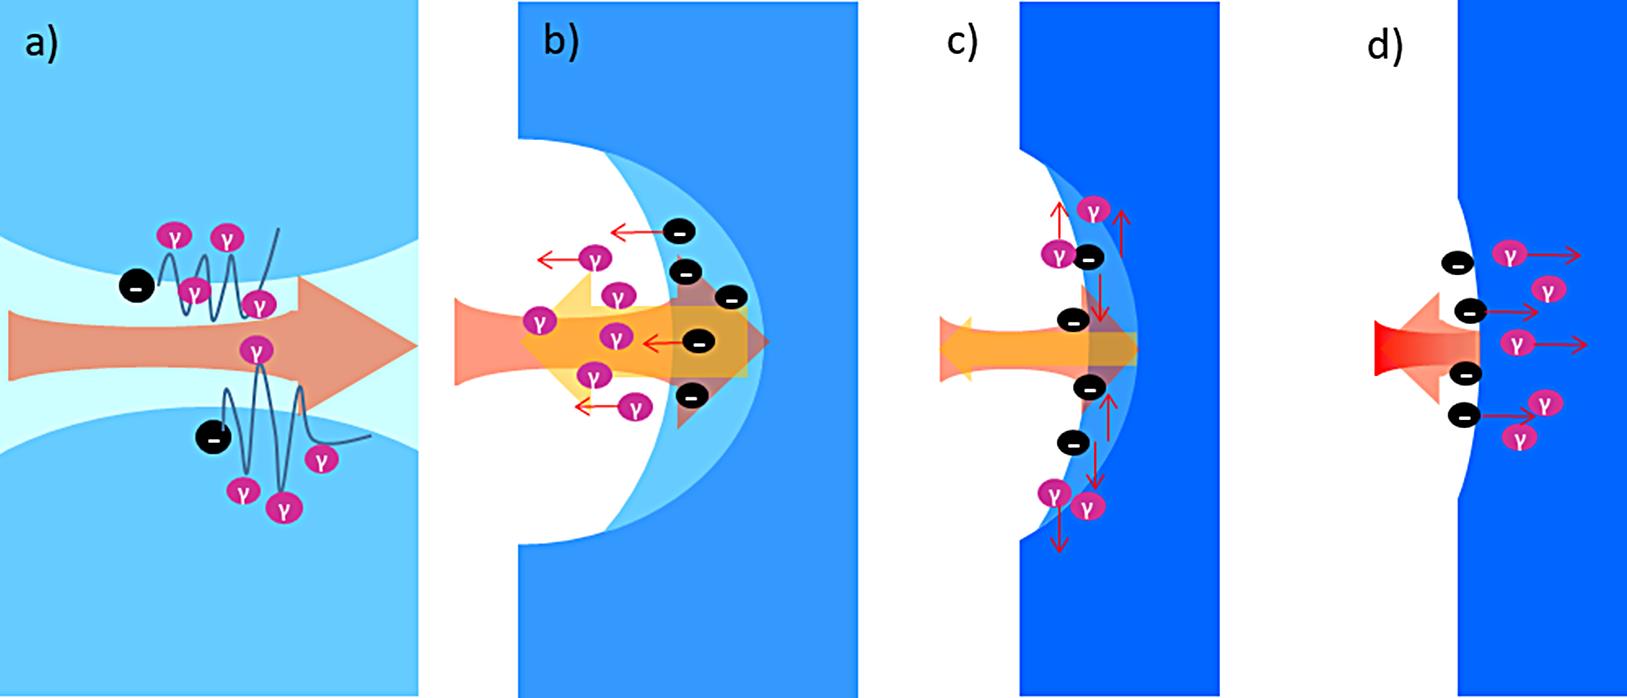
Fig. 1. Schematic of traditional γ-ray generation mechanisms at uniform plasma with different density (blue backgrounds represent plasma densities; black circles are electrons; purple represents the gamma photons; small red arrows show the moving direction of the electrons and gamma photons; light red arrows are the laser; and yellow arrows are the space charge force). (a) Low-density plasma n e
n c, forming a plasma channel. (b) Plasma density is close to the penetration threshold value n e
n th, showing the RESE process. (c) Transition region with n th<n e<n c* of the TOEE mechanism. (d) High density of n e>n c* of the SDE process.
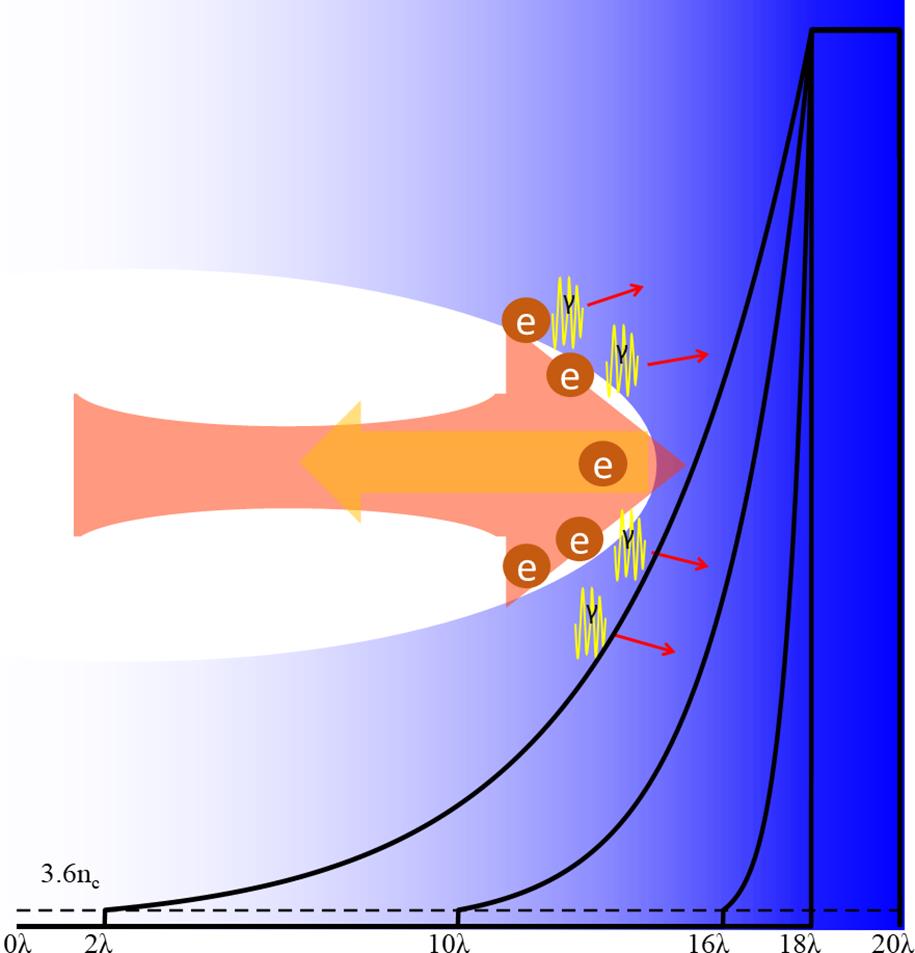
Fig. 2. Schematic of the simulation setup and γ-ray generation mechanisms for a solid target with preplasma. Electrons are accelerated in the preplasma, and then interact with the reflected laser through the piled preplasma, emitting bright gamma radiation.
Fig. 3. Temporal evolution of electron numbers with  at preplasma scale length of 0, 0.5λ, 2λ, and 4λ (the characteristic times of the maximum electron numbers are marked with arrows). The laser pulse profile at
 x = 18λ is also provided for the case of L = 0.
at preplasma scale length of 0, 0.5λ, 2λ, and 4λ (the characteristic times of the maximum electron numbers are marked with arrows). The laser pulse profile at Fig. 4. (a)–(d) Spatial density distributions of the electrons (black) and gamma photons (red) at corresponding characteristic times. (e)–(l) Phase space distribution of electron momentum (e)–(h) Px and (i)–(l) Py at the characteristic time. There are four cases: (a), (e), (i) L = 0; (b), (f), (j) L = 0.5λ (preplasma region 16–18 µm); (c), (g), (k) L = 2λ (10–18 µm); (d), (h), (l) L = 4λ (2–18 µm). The colorbars represent the electron density.
Fig. 5. The angular energy distributions  of (a)–(d) energetic electrons and (e)–(h) and gamma photons at corresponding characteristic times (all units are MeV): (a), (e)
 L = 0; (b), (f) L = 0.5λ; (c), (g) L = 2λ; (d), (h) L = 4λ. The colorbars represent the lg N of electrons or gamma photons (N represents their density).
of (a)–(d) energetic electrons and (e)–(h) and gamma photons at corresponding characteristic times (all units are MeV): (a), (e) Fig. 6. (a) The electron density (black to white colorbar) and laser field Ey (red to blue colorbar) distribution of the preplasma scale length L = 2 condition at characteristic time; (b) lineplot in the position of
 y = 5 µm for the laser field Ey , reflected laser field bp (bp =  ), and electron density (blue is the current distribution and green is the initial profile).
condition at characteristic time; (b) lineplot in the position of ), and electron density (blue is the current distribution and green is the initial profile). Fig. 7. The conversion efficiency of laser energy to (a) electrons and (b) γ-rays at various preplasma scale lengths.
Fig. 8. The conversion efficiency from laser energy to γ-rays at different scale lengths and laser parameters. The conversion efficiencies are saturated at longer scale lengths (d is the laser pulse width (FWHM) and T = 3.3 fs is the laser period for  ).
).
). 

Set citation alerts for the article
Please enter your email address

© Copyright 2018-2021 | Chinese Laser Press. All Rights Reserved 沪ICP备15018463号-20