
Jie Xu, Changjun Min, Yuquan Zhang, Jielei Ni, Gengwei Cao, Qianyi Wei, Jianjun Yang, Xiaocong Yuan, "Imaging ultrafast evolution of subwavelength-sized topography using single-probe structured light microscopy," Photonics Res. 10, 1900 (2022)
- Photonics Research
- Vol. 10, Issue 8, 1900 (2022)
Abstract
1. INTRODUCTION
Femtosecond (fs) laser–material interactions lead to many interesting phenomena such as transient demagnetization of ferromagnets, fs laser filamentation, and isomerization of proteins [1–5]. Due to strong instantaneous power, fs lasers have been applied in various fields such as laser writing, reshaping, and ablation [6–8]. To reveal the ultrafast physical/chemical dynamic response in fs laser–material interactions and promote the applications of fs lasers, especially for application in laser fabrication, a powerful microscope that can capture the ultrafast process is urgently needed [9–11].
As a candidate, optical pump–probe microscopy, including types of near-field single-point scanning [12] and far-field wide-field imaging [13], has grown into a mature ultrafast imaging technique and been widely adopted in chemical reaction, molecular dynamics, and others [14–19]. Compared to the single-point scanning type, the wide-field pump–probe microscope benefits from a much larger imaging area and faster imaging speed, therefore having proven advantages in investigating physical mechanisms and material properties in the fields of fs laser ablation and material science [20–24]. For example, by utilizing the wide-field pump–probe microscope, Fang
However, most previously studied wide-field pump–probe microscopes can achieve only two-dimensional imaging and have low spatial resolutions in micrometer scale. To expand two-dimensional imaging to three-dimensional and improve resolution, the combination of optical pump–probe microscopy and structured illumination microscopy (SIM) can be a promising approach [25], during which multiple sectional images with phase shifts are required [26–32]. However, under the condition that the damage threshold of the material is exceeded by the fs laser, it is impossible to guarantee that ultrafast processes in all repeated frames stay exactly the same. Final structures induced by different fs pulses are not perfectly the same, due to the fact that pump pulses influenced by air disturbance and other environmental factors are slightly different from each other. As a result, the multi-frame images obtained through imperfect repetition cannot reconstruct accurate sample images via the SIM algorithm. Hence, this kind of structured illumination pump–probe microscope cannot be applied to an irreversible ultrafast process during which physical/chemical properties of the sample are damaged, such as ablation.
Sign up for Photonics Research TOC. Get the latest issue of Photonics Research delivered right to you!Sign up now
To image fs laser induced irreversible ultrafast topography, a reconstruction method with a single frame is required instead of the common SIM. As a possible candidate, Fourier transform profilometry (FTP) is a 3D imaging technique that needs only one frame of the image [33–36], and has been widely used in macroscopical applications such as industrial inspection and machine vision [37–39]. Based on the triangulation method of geometrical optics [39], the height of a measured sample is considered linearly dependent on the phase calculated by FTP, and the 3D topography of the sample finally can be reconstructed [34]. Although FTP is also based on structured light illumination, it cannot achieve spatial super-resolution like SIM, but requires only a single shot of pulse and thus has great potential for imaging fs laser induced irreversible ultrafast topography. However, FTP is rarely used in optical microscopes with large numerical aperture (NA) objectives, where the sample size is too small and the spatial frequency is much higher than those in macroscopical applications. Under this condition, how to apply FTP to a high-NA microscope is still a challenge.
In this work, we propose and experimentally verify a single-probe structured light microscopy (SPSLM) that combines a pump–probe technique and wide-field structured light microscopy associated with FTP. Benefitting from the advantage of FTP, our SPSLM requires only a single frame obtained by a single structured probe pulse for 3D topography reconstruction, and thus can be used to image the ultrafast evolution of topography on a material surface influenced by a fs laser. The second harmonic of the initial fs laser is modulated as structured probe light, improving the spatial lateral resolution into the subwavelength region of
2. SYSTEM AND METHODS
A. Experimental Setup of SPSLM
The proposed SPSLM contains two subsystems, including a traditional pump–probe microscope subsystem and a structured light subsystem, as depicted in Fig. 1. The light source is an amplified Ti:sapphire laser system that generates 120 fs pulses with maximal energy of 3 mJ and a central wavelength of 800 nm. The initial pulse partially (
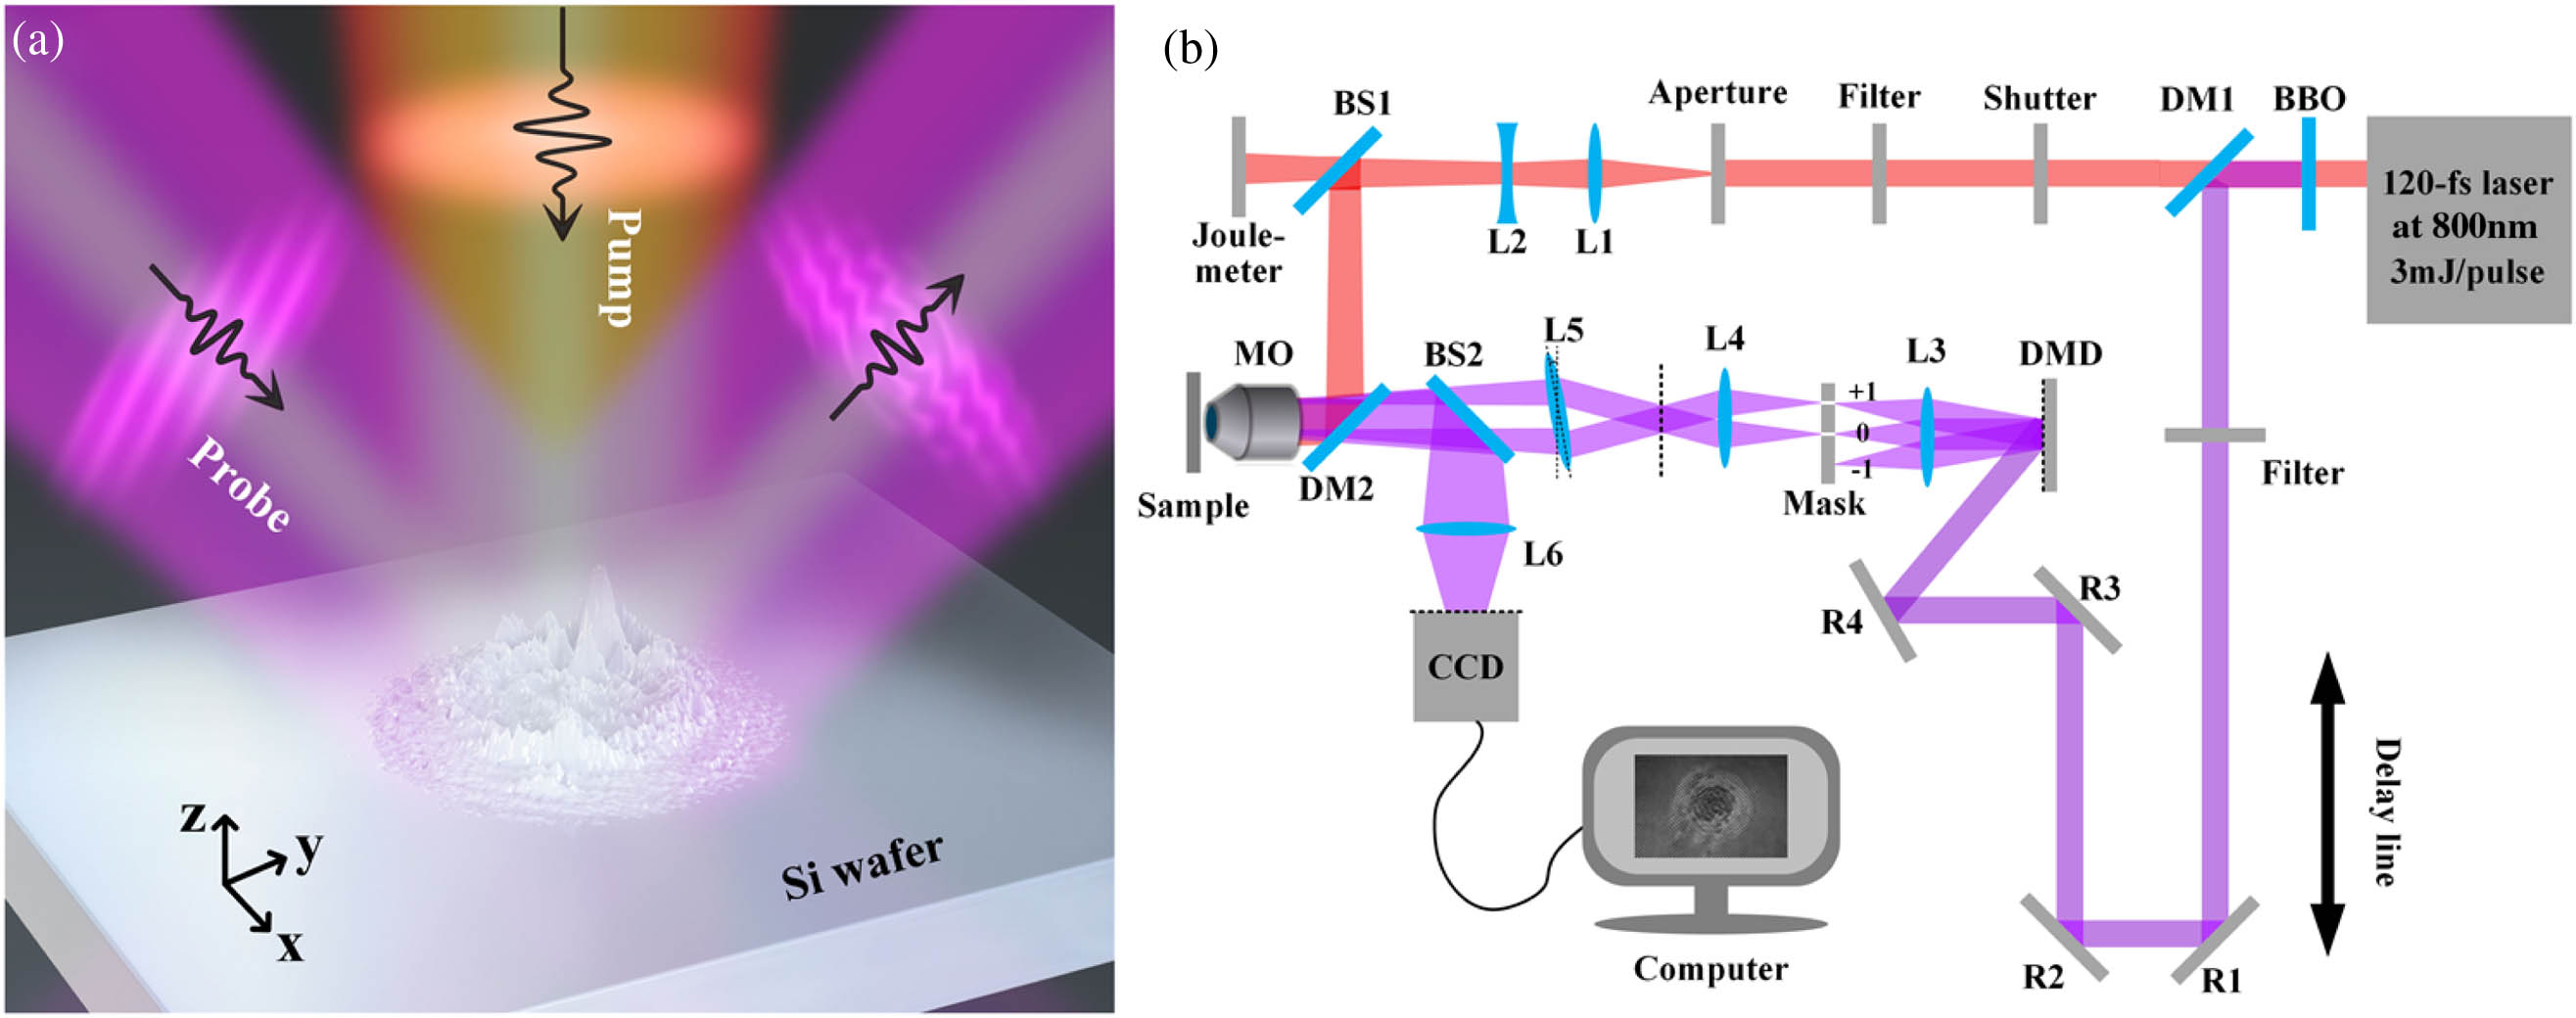
Figure 1.Schematic of the SPSLM, where red and violet indicate pump light (at 800 nm) and probe light (at 400 nm), respectively. (a) Diagram of ultrafast pulses on Si wafer. (b) Optical path of SPSLM: BBO, barium boron oxide; DM1, DM2, dichroic mirrors; L1–L6, lenses; R1–R5, reflectors; BS1, BS2, beam splitters; DMD, digital mirror device; CCD, charge-coupled device; MO, microscope objective (
The most unique feature of SPSLM is that the structured light subsystem is off-axis, which establishes the condition of a triangulation method for FTP. As shown in Fig. 1(b), the second-harmonic probe beam is directed toward the digital mirror device (DMD) to produce several diffraction orders. We select the
B. Topography Reconstruction Method
The fundamental method we used for topography reconstruction is FTP, where only one frame of a structural-light-illuminated image is required. The principle of FTP is that the light fringes illuminating on a fluctuant sample surface are deformed, and the corresponding phase shift is dependent on the fluctuation amplitude. In traditional FTP, the phase shift of reflected fringes is approximately considered linearly dependent on the height of the measured surface [33–39]. The relationship can be obtained by macroscopic system parameters. For the high-NA objective used in our SPSLM, these parameters are much smaller and difficult to be measured directly and accurately.
To calibrate this relationship, we evaluate the structured light subsystem alone by shutting the pump light and imaging a piece of polished monocrystal Si wafer (surface roughness
![]()
Figure 2.Principle and calibration of topography reconstruction. (a) Schematic of illumination light on the field of view formed by interference of the
The initial phase obtained from FTP is limited within the range from
Based on the calibration result, as well as the principle of the FTP algorithm and fringe period mentioned above, we can theoretically obtain the axial resolution (
To verify the reliability of the topography reconstruction method of FTP, we use a sample with distinctive features as shown in Fig. 3(a), which is a height map obtained via AFM. It is an ablation spot on the polished Si carbide induced by multiple fs laser pulses using our SPSLM, which contains a low-frequency pit and high-frequency LIPSS. The raw image of the sample via our structured light subsystem is shown in Fig. 3(b), and was calculated into a height map according to the FTP method. The reconstructed height map is shown in Fig. 3(c), using the same color bar as that obtained from AFM. It is obvious that both the low-frequency pit and LIPSS are distinguishable and have almost the same morphology as that of AFM. More quantitative details across the center of the pit [along dashed lines in Figs. 3(a) and 3(c)] are shown in Fig. 3(d), including two curves from SPSLM and AFM for comparison. The height curve from SPSLM agrees well with that from AFM except that near the pit edge where the height is steeply raked. This deviation may be induced from the inherent limitation of FTP, which requires that the slope of the sample surface should not be too sharp [34]. The discrepancy on the right side (
![]()
Figure 3.Verification of topography reconstruction. (a) Height map of a sample (ablation point on the surface of a polished silicon carbide, containing a pit and LIPSS) obtained via AFM; (b) raw image obtained via SPSLM; (c) reconstructed topography from the raw image; (d) height variations along the dashed lines in (a) and (c) for comparison.
3. RESULTS AND DISCUSSION
A. Single-Pulse Irradiation on Si Surface
To demonstrate the ultrafast surface imaging capability of SPSLM, the topography evolution of a monocrystalline Si surface induced by the fs laser is studied. To match the influenced area and the view field of SPSLM, the fs pump pulse obliquely impacts the sample, resulting in a slight time delay for different points on the wavefront arriving at the sample surface, as shown in Fig. 4. The raw images in the first row are captured via SPSLM at different time delays with a temporal step of 0.5 ps between the structured probe pulse and the single pump pulse controlled by the optical delay line. We can observe that the reflectivity on the left side first increases (becomes brighter), and then the bright area expands to a full circle of the pump pulse area at a time delay of about 2.5 ps. The orange dashed circle indicates the pump pulse area on the Si wafer. The increase in reflectivity in this area is due to the high-density plasma excited by the pump pulse [40,45,46]. This effect can be adaptable to set the zero point at the time delay when the increase in reflectivity begins, as Refs. [20,40] point out.
![]()
Figure 4.Raw images (first row) and reconstructed height maps (second row) in time sequence near the zero point with the step of 0.5 ps captured by SPSLM. Pump pulse impacts on Si wafer in the area in orange dashed circle, with average fluence of about
The second row in Fig. 4 shows the reconstructed height maps in time sequence corresponding to the raw images in the first row, by using the SPSLM associated with the FTP topography reconstruction algorithm. It can be seen that, in addition to the change of reflectivity, the surface morphology also changes at the same time. When the ultrashort pump pulse impacts the Si wafer, high-energy free electrons are generated and subsequently have scattering with the lattice via phonons in an ultrashort time scale, leading to the slight morphological change of the Si wafer surface, as shown by a shallow pit in Fig. 4. As the pit center is flat, fringes are slightly distorted mainly at the pit boundary in the first row of Fig. 4.
The topography evolutions on the Si surface impacted by the single pump pulse with various energies are obtained as shown in Fig. 5. The pulse energy cases of 266 nJ, 304 nJ, and 382 nJ are denoted as “energies 1–3,” respectively. Results at six time delays of 5 ps, 40 ps, 100 ps, 1 ns, 4 ns, and 10 ns are given. The time delay of the final result at the time delay of 100 ms is denoted as “
![]()
Figure 5.Ultrafast evolution of the topography on Si surface impacted by a single pump pulse with different energies of 266 nJ, 304 nJ, and 382 nJ, corresponding to the average fluences of
In the case of energy 3, a high region (bright color) occurs in the ablation area at the time delay of 40 ps, and then splits into a smaller disk region (indicated as a red arrow) and an annular (blue arrow) region at the time of 100 ps. These two regions interact with each other to form ripples at the time delay around 1 ns, then the amplitude of ripples decreases, and a pit begins to appear at the time delay of 4 ns. By comparing the final topography and that at the time delay of 10 ns, we find that they have similar structures, but the pit has shallower depth finally, which means some changes occur after 10 ns, as the results in Refs. [20,21] indicate, but beyond the measurement range of our optical delay line. In addition, the final topography maps under energies 1–3 indicate that the pulse energy is an important parameter, and lower energy leads to shallower and smaller structures. More detailed processes of the topography evolution of the Si wafer surface for energies 1–3 are given in
B. Multi-pulse Irradiation on Si Surface
An interesting phenomenon in fs laser–material interaction is the formation of LIPSS, on which numerous studies have been reported [47–50]. However, both the morphological responses and topography evolution during the ultrafast process are rarely studied, which are of great significance for understanding of the underlying mechanisms of LIPSS. By employing our SPSLM system, we have realized the LIPSS formation and its ultrafast topography evolution dynamics, as shown in Fig. 6. The sample is also a Si wafer, but with the impact of multiple laser pulses with identical energies in time sequence. The repetition rate of the pump light is set to be 10 Hz, corresponding to 100 ms time intervals of neighboring pulses. Specifically, we investigate the ultrafast topography evolution after the second and third pump pulses impacting the final topography results in Fig. 5 induced by the first pump pulse. All pump pulses are linearly polarized in the horizontal direction. Other parameters are the same as those in Fig. 5 except for the range of the color bar, with the consideration that multiple laser pulses lead to a greater change in topography. Considering every two rows as a group, the three groups in Fig. 6 correspond to energies 1–3, respectively.
![]()
Figure 6.Ultrafast topography evolution on the Si surface impacted by second and third pulses (see
As clearly displayed in Fig. 6, after the successive second and third pulses impact the structures induced by the first pulse, LIPSS phenomena begin to appear with the spatial orientation perpendicular to the direction of the linear polarization of the pump light. For the high-energy case of energy 3, the observation of LIPSSs shows the complex changes during the time delay ranging from 5 ps to 10 ns. As shown in the fifth row of Fig. 6, the LIPSSs first appear at 40 ps after the second pulse and form an annular region of periodic structures at 100 ps. Then the structured region spreads to the pit center at 1 ns and becomes clearer at 4 ns. However, at 10 ns and 100 ms after the second pulse, the LIPSSs gradually vanish, or at least, become not obvious. This trend of the topography evolution also occurs after the third pulse, as shown in the sixth row of Fig. 6. Last, some LIPSSs remain near the edge of the ablation spot, and a pit remains at the center. On the contrary, under the moderate case of energy 2, the pit center region contains obvious LIPSSs instead of a pit, as shown by the final result in the fourth row of Fig. 6. For the case of energy 2, the topography evolution is simpler than that under energy 3, that is, the LIPSSs are not clear after the second pulse, but become obvious during the whole ultrashort time after the third pulse. Especially at 1 ns and 4 ns, the altitude intercepts of LIPSSs are so great that they exceed the range of the color bar. For the low-energy case of energy 1, an interesting feature observed is that the LIPSSs appear after the third pulse at 5 ps, 40 ps, and 10 ns, but vanish at intermediate time delays of 100 ps, 1 ns, and 4 ns, as the second row of Fig. 6 shows. This phenomenon indicates the reorganization of LIPSSs during the intermediate time delay range.
The final state of LIPSSs is significant for applications such as fabrication of large-scale subwavelength gratings [51–54]. Final topography results after the third pulse obtained from SPSLM and from AFM are compared in Fig. 6. In all three energy cases, the low-frequency pit and high-frequency LIPSSs can be distinguished correctly. Results of energies 1 and 2 from SPSLM agree well with those from AFM, further proving that our SPSLM and the reconstruction method are effective and reliable. Under the situation of energy 3, the height map from AFM shows the generation of numerous nanoparticles around the ablation spot; however, they are out of resolution for SPSLM and unable to be distinguished.
Final states of topography after the third pulse in Fig. 6 also indicate that the formation of LIPSSs is closely related to the energy fluence of the pump pulse. Because of the pump pulse showing an Airy spot, the energy fluence is high in the pit center yet low near the edge, which indicates the energy fluence dependent formation of LIPSSs. For example, LIPSSs appear only in the center region for a pump pulse with lower energy fluence (energy 1 in Fig. 6), and the LIPSS region becomes larger when the pulse energy increases, as shown by the results under energy 2 in Fig. 6. For case of higher pulse energy (energy 3), LIPSSs in the pit center region are indistinct but clear near the edges. These phenomena indicate that the laser energy fluence needs to be appropriately controlled to achieve high-quality LIPSSs.
To quantify the quality of LIPSSs, we calculate the fast Fourier transformation (FFT) of the topography map and obtain the FFT power spectrum. Considering that LIPSSs appear mainly in the center region for energies 1 and 2 as shown in Fig. 6, only the center region of about
![]()
Figure 7.Process of FFT to evaluate the quality of LIPSS located in the center region (about
4. CONCLUSION
A wide-field SPSLM system is proposed and experimentally verified to image the ultrafast topography evolution induced by fs laser pulses. The FTP method is introduced in SPSLM for ultrafast topography reconstruction with only a single imaging frame, and the relationship between phase and height has been studied and calibrated. The second harmonic of the initial fs laser is chosen as the probe light to generate the interference fringes on the sample surface, resulting in a spatial lateral resolution of
As final remarks, we note that the proposed SPSLM can be further developed to achieve better performance in the future. For example, although currently the lateral resolution of SPSLM cannot break through the diffraction limit of second harmonic light due to the single-frame reconstruction method, the spatial resolution can be further improved through deep learning, and the temporal resolution can also be improved by using a shorter pulse source or pulse compression methods. SPSLM also has potential in imaging internal ultrafast processes in transparent materials by modulating 3D structured probe light. We believe that SPSLM is not only a powerful tool for visualizing and understanding the ultrafast dynamics in fs laser–material interactions, but also has bright application prospects in various fields including laser fabrication, 3D printing, and material science.
Acknowledgment
Acknowledgment. We thank Professor Jindong Tian for algorithm support. The authors acknowledge the Photonics Center of Shenzhen University for technical support.
References
[1] P. Tengdin, W. You, C. Chen, X. Shi, D. Zusin, Y. Zhang, C. Gentry, A. Blonsky, M. Keller, P. M. Oppeneer. Critical behavior within 20 fs drives the out-of-equilibrium laser-induced magnetic phase transition in nickel. Sci. Adv., 4, eaap9744(2018).
[2] P. Q. Elias, N. Severac, J. M. Luyssen, Y. B. André, I. Doudet, B. Wattellier, J. P. Tobeli, S. Albert, B. Mahieu. Improving supersonic flights with femtosecond laser filamentation. Sci. Adv., 4, eaau5239(2018).
[3] K. Pande, C. D. M. Hutchison, G. Groenhof, A. Aquila, J. S. Robinson, J. Tenboer, S. Basu, S. Boutet, D. P. DePonte, M. Liang. Femtosecond structural dynamics drives the trans/cis isomerization in photoactive yellow protein. Science, 352, 725-729(2016).
[4] A. Y. Vorobyev, C. Guo. Femtosecond laser nanostructuring of metals. Opt. Express, 14, 2164-2169(2006).
[5] Z. Lin, L. Ji, M. Hong. Enhancement of femtosecond laser-induced surface ablation via temporal overlapping double-pulse irradiation. Photon. Res., 8, 271-278(2020).
[6] J. Boisvert, A. Hlil, S. Loranger, A. Riaz, Y. Ledemi, Y. Messaddeq, K. Raman. Photosensitization agents for fs laser writing in PDMS. Sci. Rep., 12, 1623(2022).
[7] G. González-Rubio, P. Díaz-Núñez, A. Rivera, A. Prada, G. Tardajos, J. González-Izquierdo, L. Bañares, P. Llombart, L. G. Macdowell, M. A. Palafox. Femtosecond laser reshaping yields gold nanorods with ultranarrow surface plasmon resonances. Science, 358, 640-644(2017).
[8] N. Zhang, X. Zhu, J. Yang, X. Wang, M. Wang. Time-resolved shadowgraphs of material ejection in intense femtosecond laser ablation of aluminum. Phys. Rev. Lett., 99, 167602(2007).
[9] P. Ding, Y. Yao, D. Qi, C. Yang, F. Cao, Y. He, J. Yao, C. Jin, Z. Huang, L. Deng. Single-shot spectral-volumetric compressed ultrafast photography. Adv. Photon., 3, 045001(2021).
[10] Y. Yao, Y. He, D. Qi, F. Cao, J. Yao, P. Ding, C. Jin, X. Wu, L. Deng, T. Jia. Single-shot real-time ultrafast imaging of femtosecond laser fabrication. ACS Photon., 8, 738-744(2021).
[11] X. Zeng, S. Zheng, Y. Cai, Q. Lin, J. Liang, X. Lu, J. Li, W. Xie, S. Xu. High-spatial-resolution ultrafast framing imaging at 15 trillion frames per second by optical parametric amplification. Adv. Photon., 2, 056002(2020).
[12] V. Kravtsov, R. Ulbricht, J. M. Atkin, M. B. Raschke. Plasmonic nanofocused four-wave mixing for femtosecond near-field imaging. Nat. Nanotechnol., 11, 459-464(2016).
[13] G. Spektor, D. Kilbane, A. K. Mahro, B. Frank, S. Ristok, L. Gal, P. Kahl, D. Podbiel, S. Mathias, H. Giessen. Revealing the subfemtosecond dynamics of orbital angular momentum in nanoplasmonic vortices. Science, 355, 1187-1191(2017).
[14] M. C. Fischer, J. W. Wilson, F. E. Robles, W. S. Warren. Invited review article: pump-probe microscopy. Rev. Sci. Instrum., 87, 031101(2016).
[15] P. Dong, J. Cheng. Pump–probe microscopy: theory, instrumentation, and applications. Spectroscopy, 32, 2-11(2017).
[16] M. Domke, S. Rapp, M. Schmidt, H. P. Huber. Ultrafast pump-probe microscopy with high temporal dynamic range. Opt. Express, 20, 10330-10338(2012).
[17] J. Yu, W. S. Warren, M. C. Fischer. Visualization of vermilion degradation using pump-probe microscopy. Sci. Adv., 5, eaaw3136(2019).
[18] Y. Yu, X. Zhang, Z. Zhou, Z. Zhang, Y. Bao, H. Xu, L. Lin, Y. Zhang, X. Wang. Microscopic pump-probe optical technique to characterize the defect of monolayer transition metal dichalcogenides. Photon. Res., 7, 711-721(2019).
[19] Y. Tan, H. Zhao, R. Zhang, Y. Zhao, C. Zhang, X. Zhang, L. Zhang. Transient evolution of quasifree electrons of plasma in liquid water revealed by optical-pump terahertz-probe spectroscopy. Adv. Photon., 3, 015002(2021).
[20] J. Bonse, G. Bachelier, J. Siegel, J. Solis. Time-and space-resolved dynamics of melting, ablation, and solidification phenomena induced by femtosecond laser pulses in germanium. Phys. Rev. B, 74, 134106(2006).
[21] R. Fang, A. Vorobyev, C. Guo. Direct visualization of the complete evolution of femtosecond laser-induced surface structural dynamics of metals. Light Sci. Appl., 6, e16256(2017).
[22] C. Pan, L. Jiang, J. Sun, Q. Wang, F. Wang, K. Wang, Y. Lu, Y. Wang, L. Qu, T. Cui. Ultrafast optical response and ablation mechanisms of molybdenum disulfide under intense femtosecond laser irradiation. Light Sci. Appl., 9, 80(2020).
[23] T. Pflug, M. Olbrich, J. Winter, J. Schille, U. Löschner, H. Huber, A. Horn. Fluence-dependent transient reflectance of stainless steel investigated by ultrafast imaging pump–probe reflectometry. J. Phys. Chem. C, 125, 17363-17371(2021).
[24] T. Feng, G. Chen, H. Han, J. Qiao. Femtosecond-laser-ablation dynamics in silicon revealed by transient reflectivity change. Micromachines, 13, 14(2022).
[25] E. S. Massaro, A. H. Hill, E. M. Grumstrup. Super-resolution structured pump–probe microscopy. ACS Photon., 3, 501-506(2016).
[26] Y. Kim, P. T. C. So. Three-dimensional wide-field pump-probe structured illumination microscopy. Opt. Express, 25, 7369-7391(2017).
[27] M. A. A. Neil, R. Juškaitis, T. Wilson. Method of obtaining optical sectioning by using structured light in a conventional microscope. Opt. Lett., 22, 1905-1907(1997).
[28] C. Wang, K. Lee, C. Lee. Wide-field optical nanoprofilometry using structured illumination. Opt. Lett., 34, 3538-3540(2009).
[29] D. Dan, B. Yao, M. Lei. Structured illumination microscopy for super-resolution and optical sectioning. Chin. Sci. Bull., 59, 1291-1307(2014).
[30] T. Zhao, Z. Wang, T. Chen, M. Lei, B. Yao, P. R. Bianco. Advances in high-speed structured illumination microscopy. Front. Phys., 9, 672555(2021).
[31] P. Kner, B. B. Chhun, E. R. Griffis, L. Winoto, M. G. L. Gustafsson. Super-resolution video microscopy of live cells by structured illumination. Nat. Methods, 6, 339-342(2009).
[32] C. Ling, C. Zhang, M. Wang, F. Meng, L. Du, X. Yuan. Fast structured illumination microscopy via deep learning. Photon. Res., 8, 1350-1359(2020).
[33] X. Su, Q. Zhang. Dynamic 3-D shape measurement method: a review. Opt. Laser Eng., 48, 191-204(2010).
[34] X. Su, W. Chen. Fourier transform profilometry: a review. Opt. Laser Eng., 35, 263-284(2001).
[35] M. Takeda, K. Mutoh. Fourier transform profilometry for the automatic measurement of 3-D object shapes. Appl. Opt., 22, 3977-3982(1983).
[36] L. Chen, X. Nguyen, F. Zhang, T. Lin. High-speed Fourier transform profilometry for reconstructing objects having arbitrary surface colours. J. Opt., 12, 095502(2010).
[37] T. Tao, Q. Chen, J. Da, S. Feng, Y. Hu, C. Zuo. Real-time 3-D shape measurement with composite phase-shifting fringes and multi-view system. Opt. Express, 24, 20253-20269(2016).
[38] P. Yao, S. Gai, Y. Chen, W. Chen, F. Da. A multi-code 3D measurement technique based on deep learning. Opt. Laser Eng., 143, 106623(2021).
[39] F. Chen, G. M. Brown, M. Song. Overview of 3-D shape measurement using optical methods. Opt. Eng., 39, 10-22(2000).
[40] J. Liu, X. Jia, W. Wu, K. Cheng, D. Feng, S. Zhang, Z. Sun, T. Jia. Ultrafast imaging on the formation of periodic ripples on a Si surface with a prefabricated nanogroove induced by a single femtosecond laser pulse. Opt. Express, 26, 6302-6315(2018).
[41] M. Kolesik, J. Brown, A. Bahl. Modeling of ultrafast laser pulse propagation. Proc. SPIE, 9835, 983510(2016).
[42] A. M. Weiner. Ultrafast optical pulse shaping: a tutorial review. Opt. Commun., 284, 3669-3692(2011).
[43] A. M. Weiner. Femtosecond pulse shaping using spatial light modulators. Rev. Sci. Instrum., 71, 1929-1960(2000).
[44] T. H. Dou, R. Tautz, X. Gu, G. Marcus, T. Feurer, F. Krausz, L. Veisz. Dispersion control with reflection grisms of an ultra-broadband spectrum approaching a full octave. Opt. Express, 18, 27900-27909(2010).
[45] M. C. Downer, R. L. Fork, C. V. Shank. Femtosecond imaging of melting and evaporation at a photoexcited silicon surface. J. Opt. Soc. Am. B, 2, 595-599(1985).
[46] R. Gunnella, G. Zgrablic, E. Giangrisostomi, F. D’Amico, E. Principi, C. Masciovecchio, A. Di Cicco, F. Parmigiani. Ultrafast reflectivity dynamics of highly excited Si surfaces below the melting transition. Phys. Rev. B, 94, 155427(2016).
[47] S. He, J. J. J. Nivas, K. K. Anoop, A. Vecchione, M. Hu, R. Bruzzese, S. Amoruso. Surface structures induced by ultrashort laser pulses: formation mechanisms of ripples and grooves. Appl. Surf. Sci., 353, 1214-1222(2015).
[48] A. V. Dostovalov, K. A. Okotrub, K. A. Bronnikov, V. S. Terentyev, V. P. Korolkov, S. A. Babin. Influence of femtosecond laser pulse repetition rate on thermochemical laser-induced periodic surface structures formation by focused astigmatic Gaussian beam. Laser Phys. Lett., 16, 026003(2019).
[49] Y. Fuentes-Edfuf, J. A. Sanchez-Gil, C. Florian, V. Giannini, J. Solis, J. Siegel. Surface plasmon polaritons on rough metal surfaces: role in the formation of laser-induced periodic surface structures. ACS Omega, 4, 6939-6946(2019).
[50] Y. Zhang, Q. Jiang, K. Cao, T. Chen, K. Cheng, S. Zhang, D. Feng, T. Jia, Z. Sun, J. Qiu. Extremely regular periodic surface structures in a large area efficiently induced on silicon by temporally shaped femtosecond laser. Photon. Res., 9, 839-847(2021).
[51] E. Skoulas, A. C. Tasolamprou, G. Kenanakis, E. Stratakis. Laser induced periodic surface structures as polarizing optical elements. Appl. Surf. Sci., 541, 148470(2021).
[52] S. Lechago, C. García-Meca, A. Griol, M. Kovylina, L. Bellieres, J. Martí. All-silicon on-chip optical nanoantennas as efficient interfaces for plasmonic devices. ACS Photon., 6, 1094-1099(2019).
[53] C. Florian, S. V. Kirner, J. Krüger, J. Bonse. Surface functionalization by laser-induced periodic surface structures. J. Laser Appl., 32, 022063(2020).
[54] A. Y. Vorobyev, C. Guo. Multifunctional surfaces produced by femtosecond laser pulses. J. Appl. Phys., 117, 033103(2015).


Set citation alerts for the article
Please enter your email address

© Copyright 2018-2021 | Chinese Laser Press. All Rights Reserved 沪ICP备15018463号-20