• Journal of Natural Resources
  • Vol. 35, Issue 5, 1216 (2020)
Shuai LI, Bo ZHANG*, Bin MA, Qi HOU, and Hang HE
Author Affiliations
  • College of Geography and Environment Science, Northwest Normal University, Lanzhou 730070, China
  • show less
    DOI: 10.31497/zrzyxb.20200516 Cite this Article
    Shuai LI, Bo ZHANG, Bin MA, Qi HOU, Hang HE. Spatiotemporal evolution of effective accumulated temperatures of ≥5 ℃ and ≥10 ℃ based on grid data in China from 1961 to 2016[J]. Journal of Natural Resources, 2020, 35(5): 1216 Copy Citation Text show less
    Spatial distribution of climate tendency rate of effective accumulative temperature on the basis of ≥5 ℃ and ≥ 10 ℃
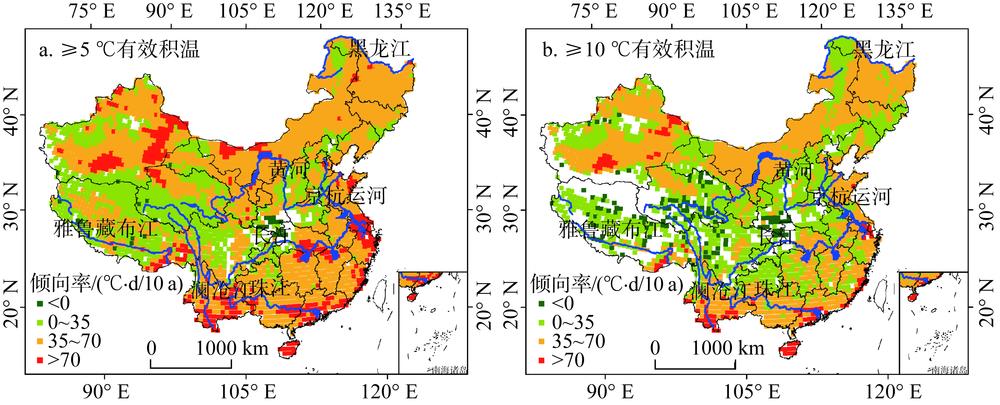
    Fig. 1. Spatial distribution of climate tendency rate of effective accumulative temperature on the basis of ≥5 ℃ and ≥ 10 ℃
    Spatial distribution of the mean effective accumulative temperature from 1961 to 2016
    Fig. 2. Spatial distribution of the mean effective accumulative temperature from 1961 to 2016
    The accumulated anomaly and MK abrupt change test of mean effective accumulative temperature for ≥5 ℃ and ≥10 ℃ from 1961 to 1990 in China
    Fig. 3. The accumulated anomaly and MK abrupt change test of mean effective accumulative temperature for ≥5 ℃ and ≥10 ℃ from 1961 to 1990 in China
    Spatial distribution of the mean effective accumulative temperature from 1961 to 1997, 1997 to 2016 and the change between them
    Fig. 4. Spatial distribution of the mean effective accumulative temperature from 1961 to 1997, 1997 to 2016 and the change between them
    The variations in the average value of the initial day (a, d), final day (b, e), duration (c, f) of the effective accumulative temperature (a-c for ≥5 ℃ and d-f for ≥10 ℃) between 1961-1997 and 1997-2016
    Fig. 5. The variations in the average value of the initial day (a, d), final day (b, e), duration (c, f) of the effective accumulative temperature (a-c for ≥5 ℃ and d-f for ≥10 ℃) between 1961-1997 and 1997-2016
    有效积温带/(℃·d)0~10001000~20002000~30003000~4000>4000
    5 ℃24.7817.7923.1720.2414.02
    10 ℃39.8929.5323.825.061.70
    Table 1. The area percentage in various interdecadal effective accumulative temperature zones for ≥5 ℃ and ≥10 ℃ from 1961 to 2016 (%)
    5 ℃/(℃·d)扩展面积减少面积实际增减10 ℃/(℃·d)扩展面积减少面积实际增减
    0~10000.181.37-1.200~10000.023.67-3.65
    1000~20001.464.09-2.621000~20003.673.280.39
    2000~30004.023.440.582000~30003.263.46-0.20
    3000~40003.414.17-0.763000~40003.460.972.48
    >40004.110.114.00>40000.970.000.97
    Table 2. The percentage of acquired area and lost area after 1997 for each accumulated temperature zone on the basis of ≥5 ℃ and ≥10 ℃ (%)
    推迟1 d以上提前0~10 d提前10~20 d提前20 d以上
    5 ℃初始日3.1582.4812.751.62
    10 ℃初始日3.8982.799.723.60
    提前1 d以上推迟0~10 d推迟10~20 d推迟20 d以上
    5 ℃结束日5.5686.546.801.10
    10 ℃结束日2.6386.085.355.94
    提前1 d以上增加0~10 d增加10~20 d增加20 d以上
    5 ℃持续时间1.3460.9532.285.44
    10 ℃持续时间1.9870.2825.732.01
    Table 3. Percentages of the changing grid points of initial and end days (ahead or delayed) and duration (increase or decrease) of ≥5 ℃ and ≥10 ℃ (%)
    Shuai LI, Bo ZHANG, Bin MA, Qi HOU, Hang HE. Spatiotemporal evolution of effective accumulated temperatures of ≥5 ℃ and ≥10 ℃ based on grid data in China from 1961 to 2016[J]. Journal of Natural Resources, 2020, 35(5): 1216
    Download Citation