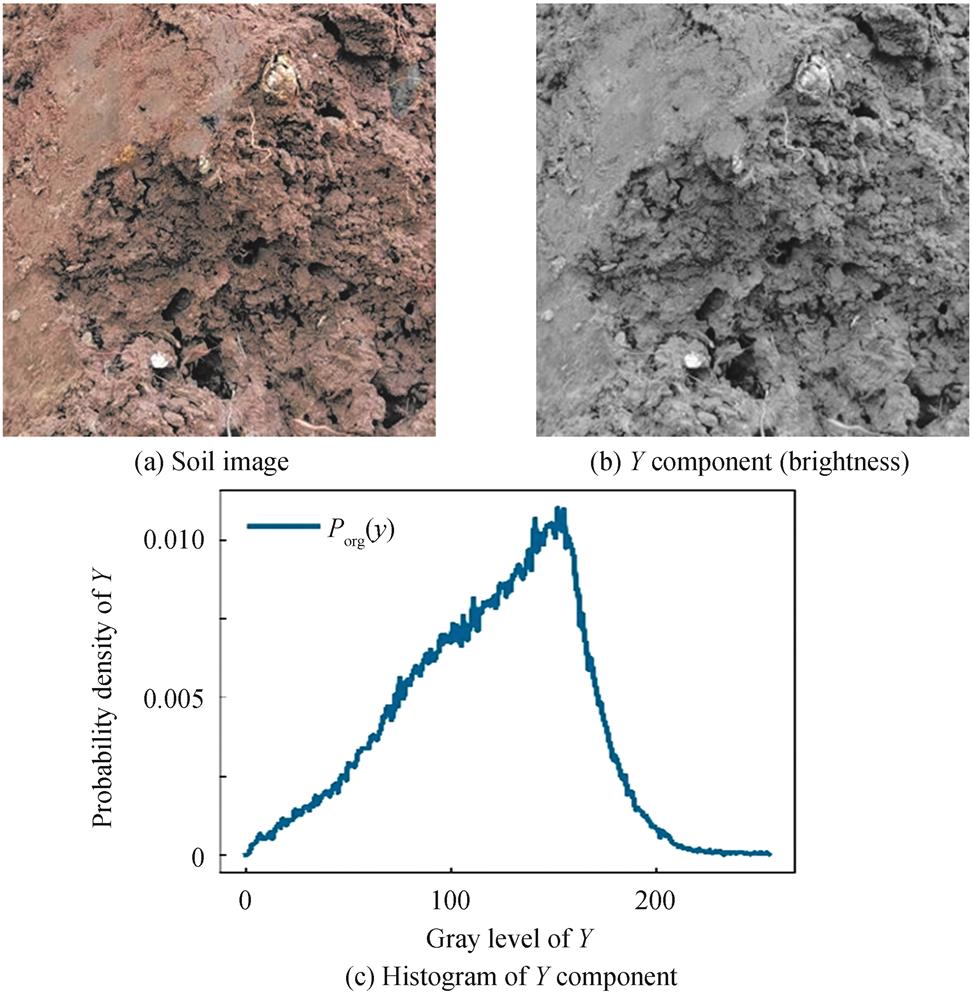
Fig. 1. The histogram analysis of Y component(brightness)of soil image
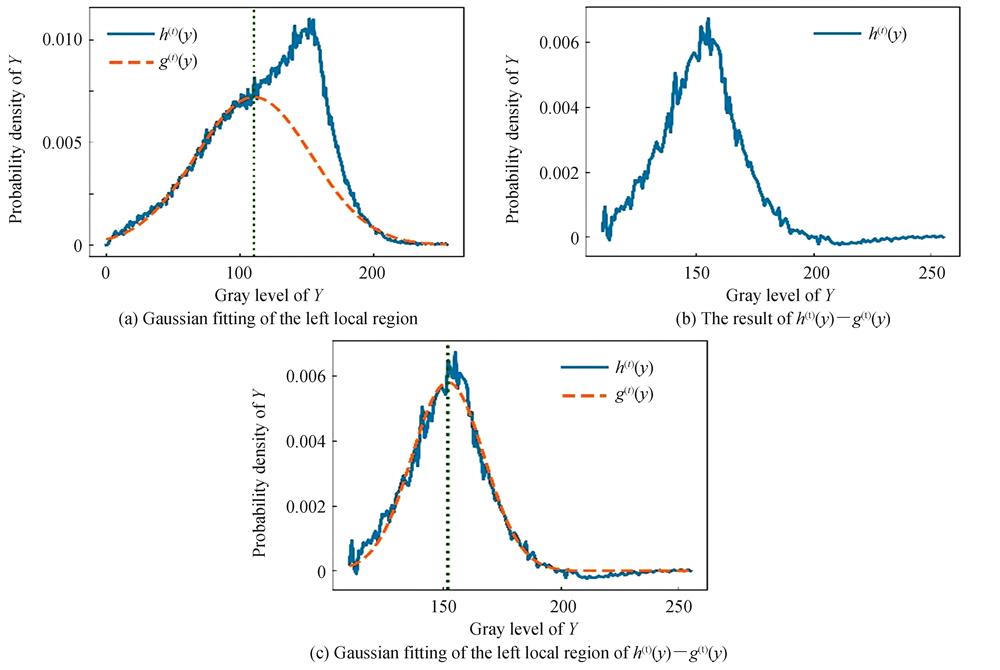
Fig. 2. Gaussian fitting of the left local region of soil image Y component histogram
Fig. 3. The process of weighted Gaussian subtractive fittings of soil image Y component(brightness)histogram
Fig. 4. Converting sub-images from low to high brightness on dataset 1(No.3 group)with different algorithms
Fig. 5. Converting sub-images from high to low brightness on dataset 1(No.7 group)with different algorithms
Fig. 6. Converting sub-images from low to high brightness in experiment 5(No.5 group)
Fig. 7. Converting sub-images from low to high brightness in experiment 6(No.9 group)
Fig. 8. Controllable brightness enhancement of soil image converted to high brightness in experiment 7(No.6 group)
Fig. 9. Controllable brightness enhancement of soil image converted to low brightness in experiment 7(No.8 group)
Fig. 10. The histogram of iterations of the weighted Gaussian subtraction fit
| 输入 | 加权高斯减法拟合曲线,土壤图像U、V分量 |
|---|
| 输出 | 增强RGB图像 | | 过程 | Step1:用式(17)和式(18)计算原始的亮度值; Step2:用式(19)计算亮度差值; Step3:用式(20)和式(21)计算增强图像的期望概率密度; Step4:用式(22)计算原始图像累积分布; Step5:用式(23)和式(24)计算增强图像期望累积分布; Step6:用式(25)计算新灰度级; Step7:用式(26)计算增强图像Y分量增强比例; Step8:用式(27)和式(28),计算U、V分量的增强结果、,并进行RGB转化,获得增强RGB图像。 | | | | | | | | |
|
Table 0. [in Chinese]
| 输入 | 土壤图像Y分量 |
|---|
| 输出 | 加权高斯减法拟合曲线 | | 过程 | Step1:用式(1)计算土壤图像分量各灰度级概率密度; Step2:令为剩余待拟合直方图; Step3:repeat{ Step3-1:根据式(7)和式(8)设置参数的搜索区间; Step3-2:根据式(9)和式(10)设置参数的搜索区间; Step3-3:根据式(11)和式(12)设置参数的搜索区间; Step3-4:依据式(5),循环搜索左局部区域的高斯拟合优化解,获得本次高斯拟合参数、、; Step3-5:计算剩余待拟合直方图,并用式(13)计算拟合剩余差和; }until(满足) Step4:用式(16)计算式(14)加权高斯减法拟合曲线。 | | | | | | | | | |
|
Table 0. [in Chinese]
| Sub-image | Algorithms | | | | | | | |
|---|
| No.3-1 | 1-D HS 2-D HS Ours | 11.645 1 11.429 7 10.405 9 | 14.350 5 14.352 6 13.301 7 | 12.216 8 11.966 9 11.045 4 | 11.541 0 11.366 8 10.361 6 | 11.941 0 11.621 2 10.306 6 | 11.899 6 11.651 6 10.571 2 | 14.257 2 14.279 0 13.264 8 | | No.3-2 | 1-D HS 2-D HS Ours | 12.214 8 12.147 7 10.868 4 | 15.602 8 15.515 2 13.551 7 | 12.107 8 11.983 9 10.519 8 | 12.335 3 12.280 7 11.055 4 | 12.755 8 12.760 5 11.581 7 | 12.399 6 12.341 7 11.052 3 | 15.649 3 15.561 9 13.633 8 | | No.3-3 | 1-D HS 2-D HS Ours | 12.873 8 12.796 7 11.445 7 | 16.330 7 16.229 5 14.607 8 | 13.680 9 13.543 0 12.681 7 | 12.983 8 12.932 9 11.800 3 | 13.046 9 13.001 7 11.683 6 | 13.237 2 13.159 2 12.055 2 | 16.346 8 16.247 8 14.609 7 | | Average | 1-D HS 2-D HS Ours | 12.244 6 12.124 7 10.906 7 | 15.428 0 15.365 8 13.820 4 | 12.668 5 12.498 0 11.415 6 | 12.286 7 12.193 5 11.072 4 | 12.581 3 12.461 1 11.190 6 | 12.512 2 12.384 2 11.226 2 | 15.417 7 15.362 9 13.837 8 |
|
Table 1. Accuracy of converting sub-images from low to high brightness on dataset 1(No.3 group)with different algorithms
| 5 | 1-D HS 2-D HS Ours | 13.468 3 13.343 1 11.682 1 | 16.575 2 16.530 4 14.827 3 | 13.922 3 13.772 1 12.264 1 | 13.412 8 13.306 6 11.642 5 | 13.536 9 13.396 5 11.611 5 | 13.624 0 13.491 7 11.839 4 | 16.535 3 16.494 9 14.803 2 |
|---|
| 6 | 1-D HS 2-D HS Ours | 14.021 4 13.8600 12.167 9 | 17.708 9 17.523 5 15.226 3 | 14.728 4 14.505 5 13.096 4 | 14.049 4 13.911 9 12.366 2 | 14.324 6 14.206 4 12.779 3 | 14.367 5 14.207 9 12.747 3 | 17.725 0 17.540 2 15.264 3 | | 7 | 1-D HS 2-D HS Ours | 14.827 9 14.555 5 12.024 0 | 18.108 0 17.942 0 15.047 3 | 15.555 4 15.221 3 12.872 7 | 14.756 4 14.518 1 12.047 0 | 14.993 2 14.732 5 12.372 1 | 15.101 7 14.823 9 12.430 6 | 18.038 4 17.881 5 15.020 9 | | 8 | 1-D HS 2-D HS Ours | 13.220 0 12.979 1 10.515 8 | 16.066 6 15.940 7 13.233 5 | 13.681 7 13.428 1 11.094 9 | 13.193 0 12.968 9 10.509 1 | 13.099 1 12.827 7 10.478 2 | 13.324 6 13.074 9 10.694 1 | 15.977 4 15.859 5 13.176 0 | | 9 | 1-D HS 2-D HS Ours | 14.253 5 14.091 5 11.746 8 | 17.751 1 17.585 2 14.843 1 | 15.061 1 14.830 9 12.984 2 | 14.264 0 14.127 1 11.866 3 | 14.493 2 14.409 3 12.243 6 | 14.606 1 14.455 8 12.364 7 | 17.728 6 17.563 5 14.844 8 | | 10 | 1-D HS 2-D HS Ours | 14.836 3 14.626 7 11.996 4 | 18.382 4 18.177 9 14.954 7 | 15.326 0 15.066 2 12.617 2 | 14.823 0 14.629 0 12.032 2 | 15.107 4 14.967 3 12.601 9 | 15.085 5 14.887 5 12.417 1 | 18.379 2 18.175 1 14.990 6 | | Average | 1-D HS 2-D HS Ours | 13.787 3 13.613 1 11.617 7 | 17.161 6 17.015 4 14.600 2 | 14.415 7 14.183 8 12.437 7 | 13.793 8 13.644 7 11.719 4 | 14.021 1 13.887 7 12.034 5 | 14.076 9 13.905 4 12.063 9 | 17.137 3 16.994 6 14.602 5 |
|
Table 2. Accuracy of converting sub-images from low to high brightness on dataset 1 with different algorithms
| Sub-image | Algorithms | | | | | | | |
|---|
| No.7-1 | 1-D HS 2-D HS Ours | 15.479 8 15.394 3 13.005 5 | 19.433 9 19.323 8 16.392 5 | 15.997 6 15.943 3 13.676 8 | 15.367 7 15.276 0 12.872 2 | 15.524 1 15.374 1 12.771 5 | 15.629 8 15.531 2 13.106 8 | 19.444 2 19.331 8 16.383 4 | | No.7-2 | 1-D HS 2-D HS Ours | 12.023 3 11.605 9 10.954 0 | 14.682 1 14.529 6 13.967 4 | 12.517 8 12.179 7 11.789 1 | 12.057 2 11.589 8 10.861 6 | 11.779 7 11.450 2 10.915 8 | 12.118 2 11.739 9 11.188 8 | 14.756 5 14.580 3 13.987 0 | | No.7-3 | 1-D HS 2-D HS Ours | 15.482 5 15.315 4 10.619 1 | 19.402 0 19.309 0 13.257 4 | 15.049 5 14.907 7 11.756 6 | 15.860 0 15.686 4 10.998 5 | 17.235 7 17.081 1 13.589 5 | 16.048 4 15.891 7 12.114 8 | 19.462 7 19.369 8 13.367 2 | | Average | 1-D HS 2-D HS Ours | 14.328 5 14.105 2 11.526 2 | 17.839 3 17.720 8 14.539 1 | 14.521 6 14.343 6 12.407 5 | 14.428 3 14.184 1 11.577 4 | 14.846 5 14.635 1 12.425 6 | 14.598 8 14.387 6 12.136 8 | 17.887 8 17.760 6 14.579 2 |
|
Table 3. Accuracy of converting sub-images from high to low brightness on dataset 1(No.7 group)with different algorithms
| 10 | 1-D HS 2-D HS Ours | 15.127 1 14.961 8 11.719 6 | 18.884 6 18.758 6 14.607 9 | 15.043 9 14.882 7 12.414 3 | 15.270 5 15.106 1 11.808 1 | 15.853 7 15.684 5 12.699 2 | 15.389 4 15.224 4 12.307 2 | 18.908 1 18.781 8 14.651 4 |
|---|
| Average | 1-D HS 2-D HS Ours | 13.880 3 13.766 7 11.432 1 | 17.466 6 17.399 6 14.400 6 | 14.015 0 13.927 6 12.141 4 | 14.028 4 13.906 2 11.565 0 | 14.454 7 14.332 7 12.261 0 | 14.166 0 14.055 5 11.989 1 | 17.499 7 17.428 7 14.428 0 |
|
Table 4. Accuracy of converting sub-images from high to low brightness on dataset 1 with different algorithms
| Sub-image | Brightness base point | Base point +10 | Base point +20 | Base point +30 | Base point +40 | Base point +50 | Effective range |
|---|
| No.5-1 | 81.042 9 | 1.000 0 | 1.000 0 | 0.800 0 | 0.400 0 | 0.400 0 | [0,30] | | No.5-2 | 80.919 3 | 1.000 0 | 1.000 0 | 0.800 0 | 0.400 0 | 0.200 0 | [0,30] | | No.5-3 | 68.878 3 | 1.000 0 | 1.000 0 | 1.000 0 | 0.600 0 | 0.400 0 | [0,30] | | No.5-4 | 107.712 9 | 1.000 0 | 1.000 0 | 0.800 0 | 0.800 0 | 0.400 0 | [0,40] | | No.5-5 | 119.603 7 | 1.000 0 | 1.000 0 | 0.800 0 | 0.600 0 | 0.200 0 | [0,30] | | No.5-6 | 116.963 9 | 1.000 0 | 1.000 0 | 1.000 0 | 0.800 0 | 0.200 0 | [0,40] | | No.5-7 | 150.225 4 | 1.000 0 | 1.000 0 | 1.000 0 | 0.800 0 | 0.200 0 | [0,40] | | No.5-8 | 146.443 3 | 1.000 0 | 1.000 0 | 0.800 0 | 0.600 0 | 0.200 0 | [0,30] | | No.5-9 | 146.570 0 | 1.000 0 | 1.000 0 | 1.000 0 | 0.600 0 | 0.400 0 | [0,30] |
|
Table 5. Subjective evaluation score and effective range of converting sub-images from low to high brightness in experiment 5(No.5 group)
| Sub-image | Brightness base point | Base point -10 | Base point -20 | Base point -30 | Base point -40 | Base point -50 | Effective range |
|---|
| No.9-1 | 81.788 1 | 1.000 0 | 1.000 0 | 0.800 0 | 0.800 0 | 0.600 0 | [-40,0] | | No.9-2 | 82.425 3 | 1.000 0 | 1.000 0 | 0.800 0 | 0.600 0 | 0.400 0 | [-30,0] | | No.9-3 | 83.403 4 | 1.000 0 | 1.000 0 | 0.800 0 | 0.400 0 | 0.400 0 | [-30,0] | | No.9-4 | 128.258 3 | 1.000 0 | 1.000 0 | 0.800 0 | 0.400 0 | 0.400 0 | [-30,0] | | No.9-5 | 139.228 0 | 1.000 0 | 1.000 0 | 0.800 0 | 0.800 0 | 0.600 0 | [-40,0] | | No.9-6 | 124.559 0 | 1.000 0 | 1.000 0 | 1.000 0 | 0.600 0 | 0.200 0 | [-30,0] | | No.9-7 | 143.997 4 | 1.000 0 | 1.000 0 | 0.800 0 | 0.600 0 | 0.400 0 | [-30,0] | | No.9-8 | 147.375 6 | 1.000 0 | 1.000 0 | 0.800 0 | 0.600 0 | 0.400 0 | [-30,0] | | No.9-9 | 144.343 0 | 1.000 0 | 1.000 0 | 0.800 0 | 0.600 0 | 0.400 0 | [-30,0] |
|
Table 6. Subjective evaluation score and effective range of converting sub-images from high to low brightness in experiment 6(No.9 group)
| Sub-image | Brightness base point | Base point +10 | Base point +20 | Base point +30 |
|---|
| 1-D HS | 2-D HS | Ours | 1-D HS | 2-D HS | Ours | 1-D HS | 2-D HS | Ours |
|---|
| No.6-1 | 138.050 8 | 2.841 0 | 2.472 2 | 0.721 4 | 4.266 3 | 3.886 9 | 1.161 2 | 6.000 4 | 5.693 3 | 1.689 3 | | No.6-2 | 127.270 9 | 1.960 6 | 0.939 5 | 0.481 8 | 2.055 6 | 1.939 6 | 1.080 7 | 3.213 4 | 3.063 8 | 1.492 7 | | No.6-3 | 63.996 2 | 0.805 0 | 2.151 9 | 0.527 4 | 1.754 2 | 3.106 0 | 0.592 4 | 2.490 2 | 3.860 5 | 0.603 7 | | Average | — | 1.565 4 | 1.715 0 | 0.558 1 | 2.671 6 | 2.848 1 | 0.896 7 | 3.887 0 | 4.081 9 | 1.188 9 |
|
Table 7. Accuracy of the controllable brightness enhancement of soil image converted to high brightness in experiment 7(No.6 group)
| Group | Base point +10 | Base point +20 | Base point +30 |
|---|
| 1-D HS | 2-D HS | Ours | 1-D HS | 2-D HS | Ours | 1-D HS | 2-D HS | Ours |
|---|
| 1 | 1.937 8 | 1.803 2 | 0.824 1 | 3.292 2 | 3.211 2 | 1.197 2 | 4.742 7 | 4.715 1 | 1.584 4 | | 2 | 1.480 9 | 1.939 2 | 0.707 6 | 2.311 6 | 3.269 4 | 0.894 2 | 3.536 5 | 4.536 4 | 0.989 8 | | 3 | 1.827 9 | 1.830 1 | 0.833 8 | 3.203 4 | 3.186 9 | 1.149 5 | 4.662 0 | 4.655 9 | 1.426 3 | | 4 | 0.868 7 | 1.269 4 | 0.485 5 | 1.103 1 | 3.309 7 | 0.602 4 | 2.450 9 | 4.756 8 | 0.614 3 | | 5 | 1.425 1 | 1.296 3 | 0.501 6 | 2.610 1 | 2.459 7 | 0.752 7 | 3.844 0 | 3.710 1 | 0.969 7 | | 6 | 1.565 4 | 1.715 0 | 0.558 1 | 2.671 6 | 2.848 1 | 0.896 7 | 3.887 0 | 4.081 9 | 1.188 9 | | 7 | 2.668 2 | 1.811 1 | 0.737 9 | 2.908 9 | 2.941 5 | 1.136 7 | 4.121 5 | 4.708 4 | 1.413 9 | | 8 | 2.014 3 | 1.734 8 | 0.954 3 | 3.123 9 | 2.956 5 | 1.474 7 | 4.560 8 | 4.407 5 | 1.921 0 | | 9 | 2.440 1 | 2.204 0 | 0.779 9 | 3.764 5 | 3.529 1 | 1.257 5 | 5.384 5 | 5.216 6 | 1.638 3 | | 10 | 1.137 3 | 1.502 7 | 0.342 6 | 2.345 0 | 2.738 2 | 0.470 0 | 3.426 2 | 3.881 5 | 0.513 1 | | Average | 1.736 6 | 1.710 6 | 0.672 6 | 2.733 4 | 3.045 0 | 0.983 2 | 4.061 6 | 4.467 0 | 1.226 0 |
|
Table 8. Accuracy of the controllable brightness enhancement of soil image converted to high brightness in experiment 7(dataset 2)
| Sub-image | Brightness base point | Base point -10 | Base point -20 | Base point -30 |
|---|
| 1-D HS | 2-D HS | Ours | 1-D HS | 2-D HS | Ours | 1-D HS | 2-D HS | Ours |
|---|
| No.8-1 | 126.067 0 | 0.365 0 | 0.697 0 | 0.155 3 | 0.900 0 | 1.203 6 | 0.669 0 | 1.625 8 | 1.983 7 | 1.535 8 | | No.8-2 | 127.363 1 | 0.343 8 | 0.502 5 | 0.319 4 | 0.904 2 | 1.077 7 | 0.178 9 | 1.685 0 | 1.953 0 | 1.054 6 | | No.8-3 | 121.752 3 | 0.548 9 | 0.742 2 | 0.151 8 | 1.190 9 | 1.386 1 | 0.435 4 | 2.162 5 | 2.414 1 | 1.243 2 | | Average | — | 0.419 2 | 0.647 2 | 0.208 9 | 0.998 4 | 1.222 5 | 0.427 8 | 1.824 4 | 2.117 0 | 1.277 9 |
|
Table 9. Accuracy of the controllable brightness enhancement of soil image converted to low brightness in experiment 7(No.8 group)
| Group | Base point -10 | Base point-20 | Base point -30 |
|---|
| 1-D HS | 2-D HS | Ours | 1-D HS | 2-D HS | Ours | 1-D HS | 2-D HS | Ours |
|---|
| 1 | 0.385 1 | 0.715 0 | 0.315 9 | 0.951 8 | 1.252 0 | 0.473 7 | 1.750 8 | 2.003 8 | 1.369 6 | | 2 | 0.557 3 | 0.779 5 | 0.301 4 | 1.210 5 | 1.448 2 | 0.297 8 | 2.211 8 | 2.453 1 | 1.189 8 | | 3 | 0.584 1 | 0.904 0 | 0.257 6 | 1.243 3 | 1.567 6 | 0.297 7 | 2.213 6 | 2.522 5 | 1.208 0 | | 4 | 0.643 2 | 0.901 8 | 0.270 5 | 1.367 4 | 1.632 7 | 0.218 4 | 2.419 3 | 2.660 0 | 1.125 8 | | 5 | 0.516 4 | 0.751 4 | 0.332 6 | 1.177 0 | 1.442 9 | 0.158 8 | 2.182 4 | 2.405 6 | 1.057 6 | | 6 | 0.558 1 | 0.978 5 | 0.244 6 | 1.179 4 | 1.587 9 | 0.255 4 | 2.112 0 | 2.479 6 | 1.220 1 | | 7 | 0.346 2 | 0.604 6 | 0.182 3 | 0.956 3 | 1.225 0 | 0.467 1 | 1.794 7 | 2.077 2 | 1.317 0 | | 8 | 0.419 2 | 0.647 2 | 0.208 9 | 0.998 4 | 1.222 5 | 0.427 8 | 1.824 4 | 2.117 0 | 1.277 9 | | 9 | 0.604 8 | 0.886 4 | 0.207 2 | 1.253 6 | 1.543 5 | 0.392 8 | 2.202 7 | 2.532 9 | 1.209 9 | | 10 | 0.700 2 | 1.044 9 | 0.425 3 | 1.415 5 | 1.728 4 | 0.187 5 | 2.404 6 | 2.741 9 | 1.120 6 | | Average | 0.531 5 | 0.821 3 | 0.274 6 | 1.175 3 | 1.465 1 | 0.317 7 | 2.111 6 | 2.399 4 | 1.209 6 |
|
Table 10. Accuracy of the controllable brightness enhancement of soil image converted to low brightness in experiment 7(dataset 2)