
Wang Xia, Xu Can, Zhang Feng, Li Peng. Anomaly Detection Method for Working Status of Low-Orbit Space Objects Based on Photometric Data[J]. Chinese Journal of Lasers, 2020, 47(3): 304005
- Chinese Journal of Lasers
- Vol. 47, Issue 3, 304005 (2020)
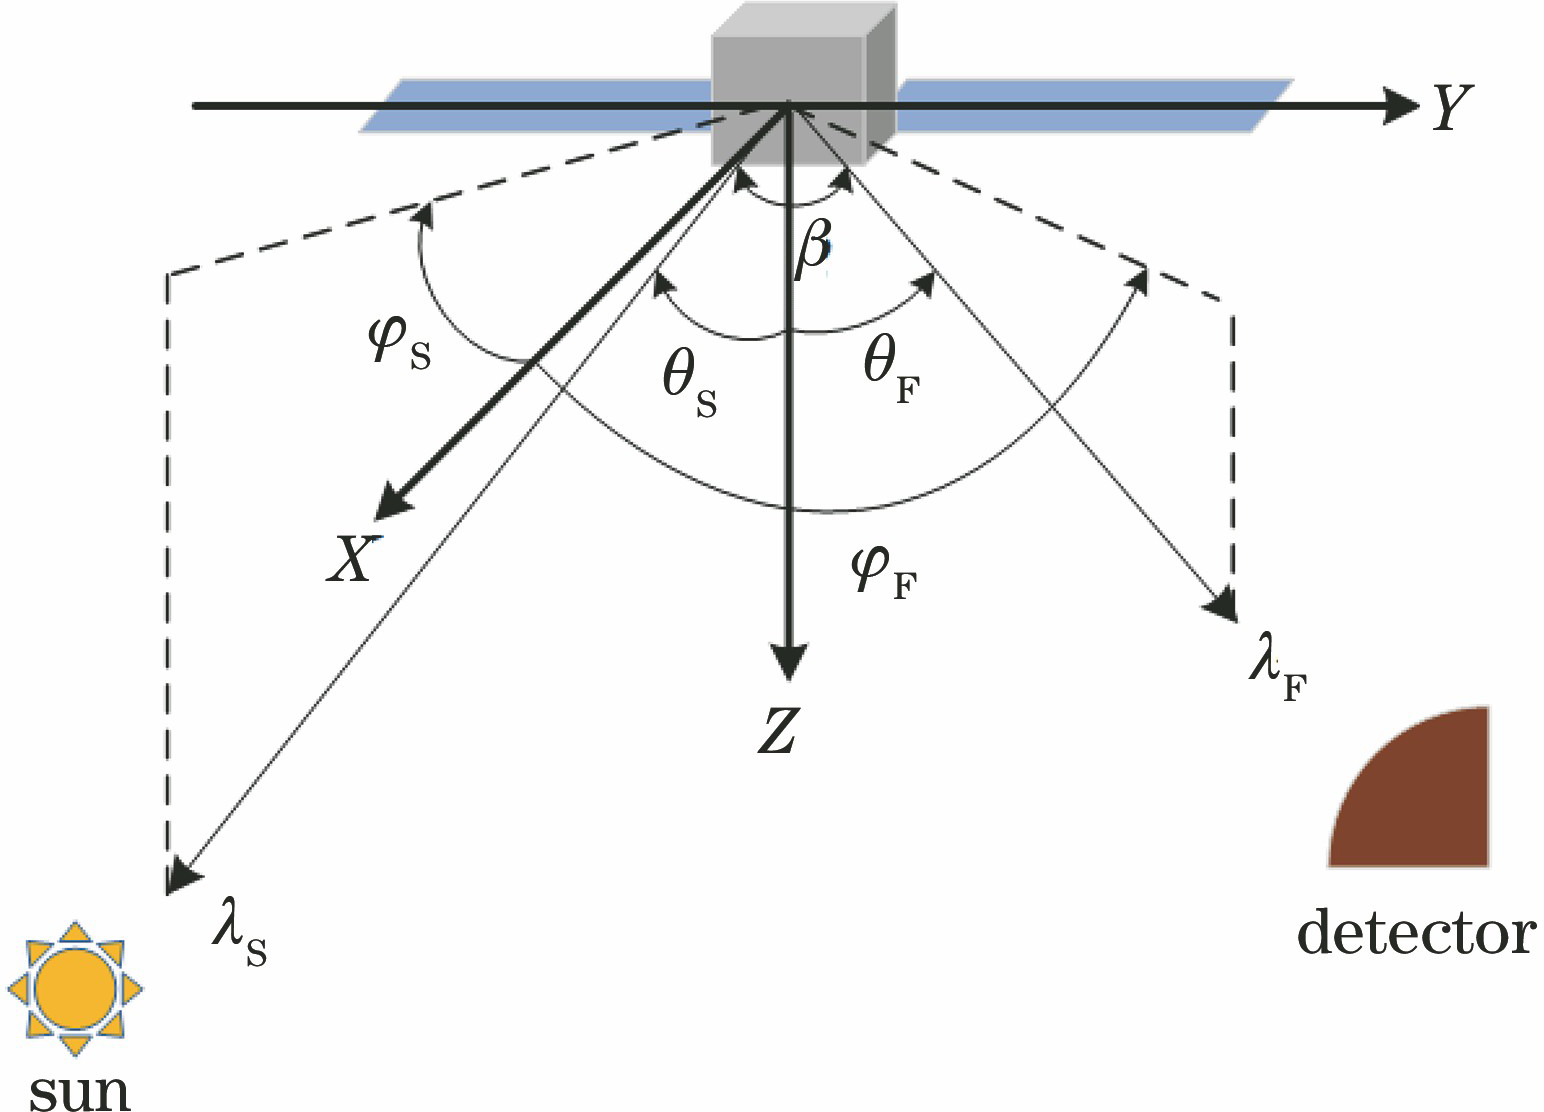
Fig. 1. Schematic of observation geometry
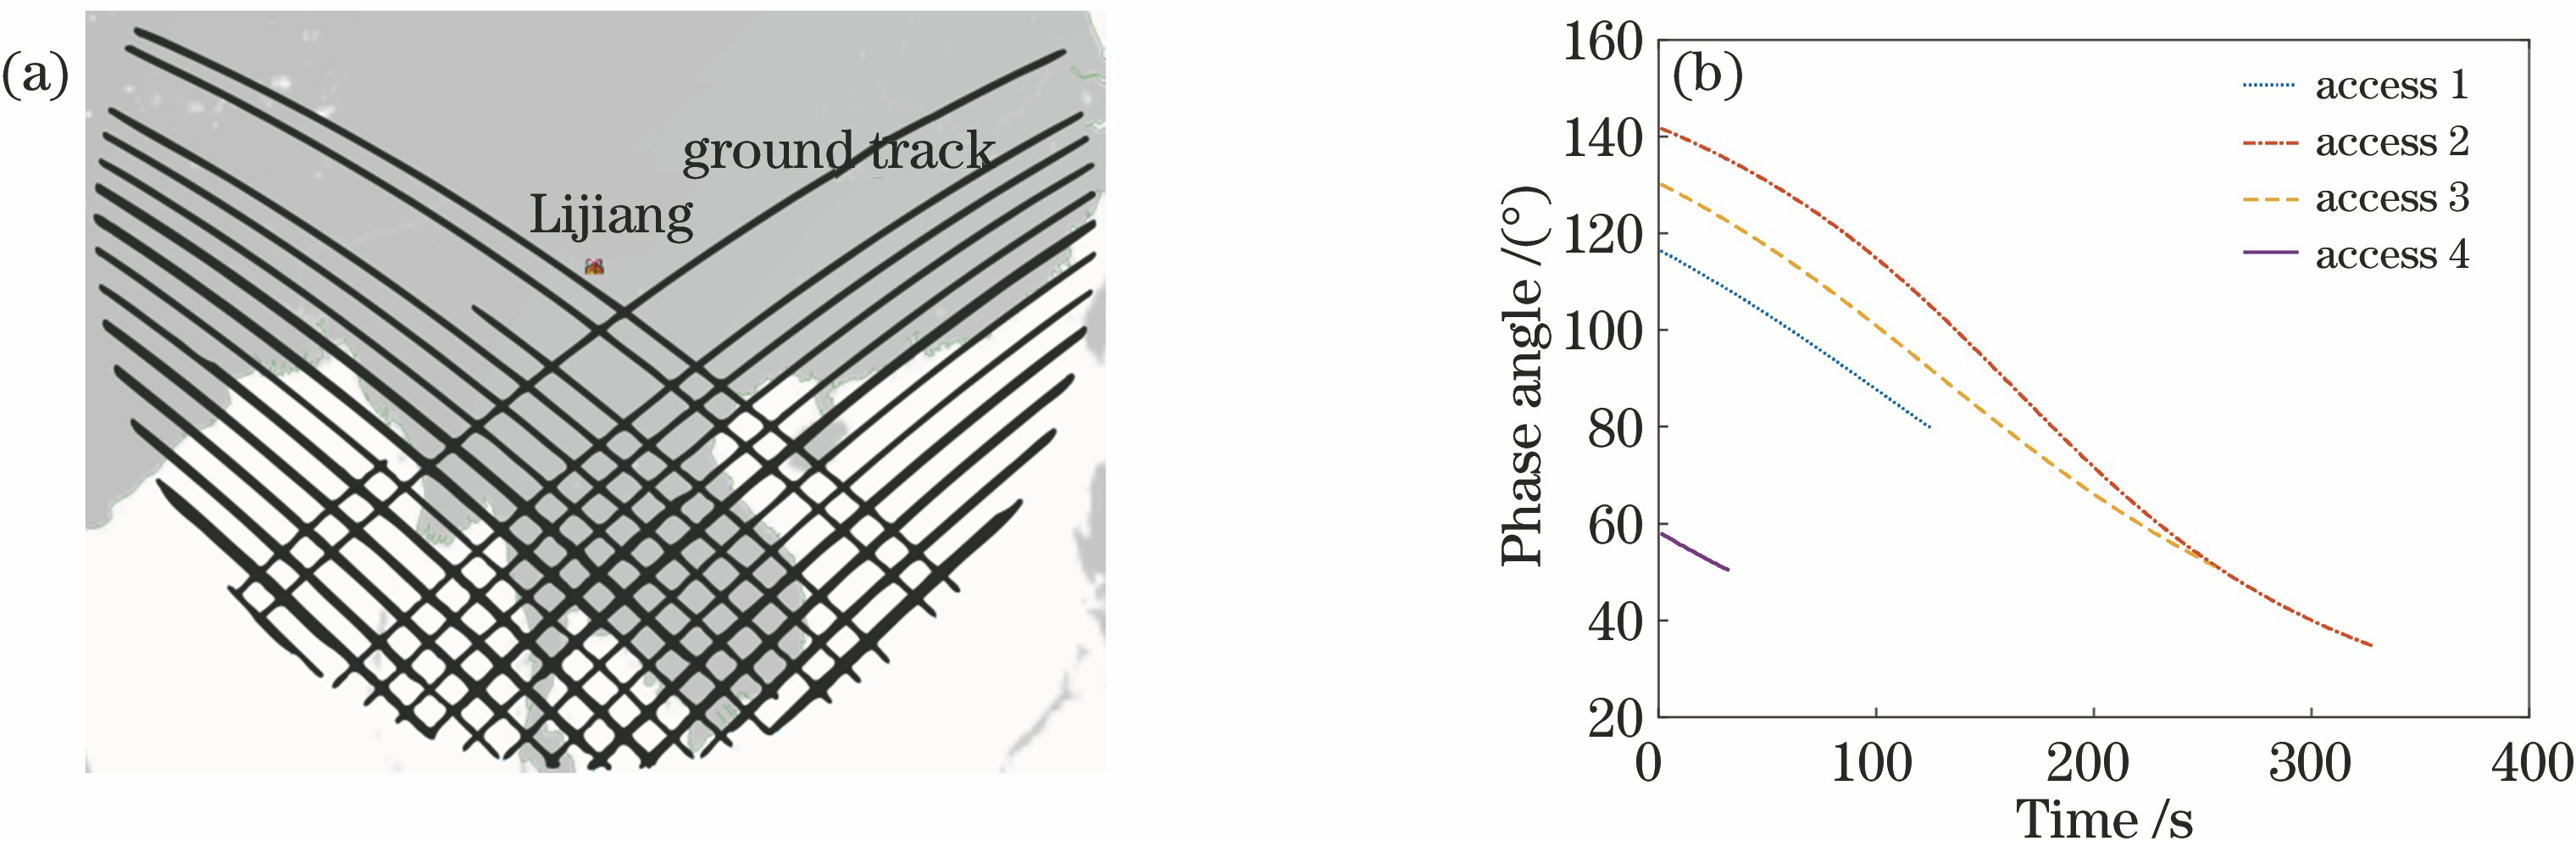
Fig. 2. Low-orbit objects observation. (a) Track of subsatellite point; (b) observation geometry of different windows varies with time
Fig. 3. OCS curves of space objects at different observation geometry. (a) Three-axis stabilization; (b) spinning
Fig. 4. Schematic of the forward direction of nodes in a warping path
Fig. 5. Schematic of space object with normal working status
Fig. 6. Schematic of space object with abnormal working status. (a) Offset of 30°; (b) offset of 90°; (c) offset of 130°; (d) spinning about body Z; (e) sun alignment with nadir constraint
Fig. 7. Three space object models. (a) Fengyun; (b) GPS; (c) Tiangong
Fig. 8. DTW distance between phase angle curves of similar access
Fig. 9. Typical examples of phase angle variation in similar access
Fig. 10. DTW distance between OCS curves of similar access
Fig. 11. Typical OCS variation of similar access
Fig. 12. Abnormal working status detection of Fengyun. (a) Abnormal pointing; (b) abnormal rotation
Fig. 13. Abnormal working status detection of GPS. (a) Abnormal pointing; (b) abnormal rotation
Fig. 14. Abnormal working status detection of Tiangong. (a) Abnormal pointing; (b) abnormal rotation
|
Table 1. Improved Phong model parameters of some satellite surface materials
| |||||||||||||||||||||||||||||||||||||||||||||||||||||||||||
Table 2. Anomaly recognition rate corresponding of each working state

Set citation alerts for the article
Please enter your email address
© Copyright 2018-2021 | Chinese Laser Press. All Rights Reserved 沪ICP备15018463号-20