• Journal of Geo-information Science
  • Vol. 22, Issue 3, 361 (2020)
Chun WANG1、1、2、2、*, Yan XU1、1、2、2, Ling JIANG1、1、2、2, and Mingwei ZHAO1、1、2、2
Author Affiliations
  • 1Geographic Information and Tourism College ,Chuzhou University, Chuzhou 239000, China
  • 1滁州学院地理信息与旅游学院,滁州 239000
  • 2Anhui Engineering Laboratory of Geo-information Smart Sensing and Services, Chuzhou 239000, China
  • 2安徽省地理信息智能感知与服务工程实验室,滁州 239000
  • show less
    DOI: 10.12082/dqxxkx.2020.190235 Cite this Article
    Chun WANG, Yan XU, Ling JIANG, Mingwei ZHAO. Accuracy Assessment of Local Slope Concave-convex Properties based on Multi-scale Gridded DEMs[J]. Journal of Geo-information Science, 2020, 22(3): 361 Copy Citation Text show less
    Schematic diagram of DEM local slope shapes
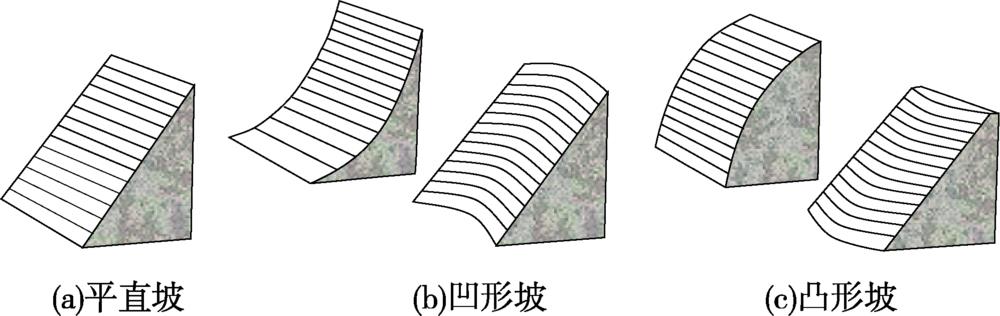
    Fig. 1. Schematic diagram of DEM local slope shapes
    Illustration of slope with a single morphology
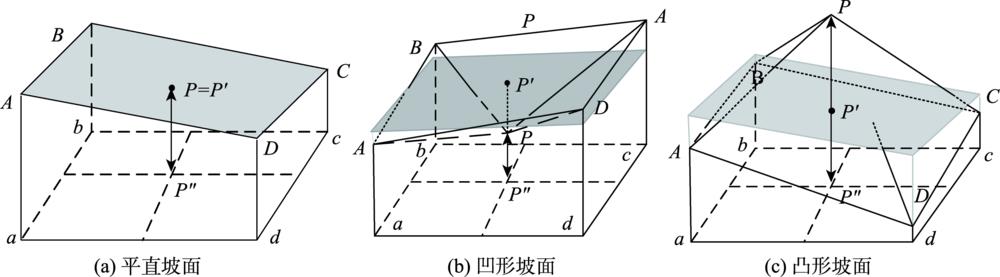
    Fig. 2. Illustration of slope with a single morphology
    Hillshade of 5 m DEM in test area
    Fig. 3. Hillshade of 5 m DEM in test area
    Spatial distribution of contour register differences under different DEM cell sizes
    Fig. 4. Spatial distribution of contour register differences under different DEM cell sizes
    Spatial distribution of concave and convex accuracy indexes of DEM local slope shapes
    Fig. 5. Spatial distribution of concave and convex accuracy indexes of DEM local slope shapes
    Spatial distribution of maximum and minimum of elevation numerical error
    Fig. 6. Spatial distribution of maximum and minimum of elevation numerical error
    Etax_P代表含义
    2局地坡面形态由原来的凹形坡面变为凸形坡面
    1局地坡面形态由原来的凹形坡面变成平直坡面,或由原来的平直坡面变成凸形坡面
    0局地坡面形态没有变化
    -1局地坡面形态由原来的凸形坡面变成平直坡面,或由原来的平直坡面变成凹形坡面
    -2局地坡面形态由原来的凸形坡面变为凹形坡面
    Table 1. Means of Etax_P
    序号指标名称计算公式指标含义公式编号
    1算数平均值Ex̅=i=1nEtax_in所有检测点凸凹性误差的平均值。主要反映与局地坡面形态凸凹性误差是否存在系统规律。Etax_i含义见表1,n为总检测点个数(3)
    2正确率值Ex_0=k0n×100k0是所有检测点中凸凹性未发生改变的坡面个数,n为总检测点个数(4)
    3渐变率值Ex_1=k1n×100k1是所有检测点中按照“凸平凹或凹平凸”次序,发生凸变平、平变凹、凹变平或平变凸等变化的坡面个数,n为总检测点个数(5)
    4跃变率值Ex_2=k2n×100k2是所有检测点中从“凸平凹或凹平凸”次序,发生凸变凹或凹变凸变化的坡面个数,n为总检测点个数(6)
    Table 2. Concave and convex accuracy indexes of local slope shapes
    DEM格网分辨率/m正确率/%渐变率/%跃变率/%
    凹变平或平变凸凸变平或平变凹合计凹变凸凸变凹合计
    1096.81±0.02361.55±0.01191.50±0.01783.05±0.02220.08±0.00190.07±0.00240.14±0.0033
    1594.66±0.01922.37±0.01692.22±0.01654.58±0.02220.38±0.00770.38±0.00790.76±0.0090
    2590.88±0.02633.09±0.02112.84±0.03085.93±0.02481.59±0.01771.50±0.01852.98±0.0206
    3587.41±0.03673.41±0.02573.12±0.02186.53±0.03133.14±0.01732.92±0.02156.06±0.0216
    4583.42±0.06003.58±0.02183.29±0.02556.87±0.02755.07±0.02814.65±0.03929.72±0.0563
    5579.42±0.09863.59±0.02593.35±0.02726.94±0.03147.08±0.04016.56±0.093713.63±0.1027
    6575.43±0.12923.61±0.03173.41±0.02987.02±0.03789.08±0.05578.47±0.120017.55±0.1151
    7571.96±0.14993.56±0.02353.42±0.01976.99±0.033310.85±0.097610.20±0.061321.05±0.1409
    8570.14±0.19513.63±0.04133.50±0.03837.12±0.054711.67±0.131311.07±0.056322.74±0.1696
    9568.62±0.10233.78±0.04643.62±0.02647.40±0.042612.22±0.095811.76±0.069023.98±0.1183
    10566.18±0.17753.86±0.03863.70±0.03057.56±0.042713.36±0.131412.89±0.108026.26±0.1451
    11565.57±0.16954.19±0.04783.99±0.04958.18±0.052713.28±0.128912.97±0.082026.25±0.1567
    12564.68±0.31534.72±0.07894.48±0.06349.20±0.101713.15±0.220712.98±0.147926.12±0.2512
    13561.91±0.32434.58±0.05074.41±0.05098.99±0.076314.73±0.213514.38±0.122229.11±0.2769
    14561.05±0.29895.17±0.09544.94±0.124710.11±0.201514.52±0.150114.33±0.152128.85±0.2212
    15559.29±0.54495.44±0.13995.22±0.136210.65±0.268015.17±0.251514.88±0.173030.05±0.3604
    Table 3. Concave and convex accuracy indexes of DEM local slope shapes
    Chun WANG, Yan XU, Ling JIANG, Mingwei ZHAO. Accuracy Assessment of Local Slope Concave-convex Properties based on Multi-scale Gridded DEMs[J]. Journal of Geo-information Science, 2020, 22(3): 361
    Download Citation