• Resources Science
  • Vol. 42, Issue 8, 1604 (2020)
Zhe YOU1、3, Jinhua Cheng2、3、*, Tong WU1, and Ran WANG2、3
Author Affiliations
  • 1School of Law and Business, Wuhan Institute of Technology, Wuhan 430205, China
  • 2ddr-line>2. School of Economics & Management, China University of Geosciences (Wuhan), Wuhan 430074, China
  • 3Research Center of Resource and Environmental Economics, China University of Geosciences (Wuhan), Wuhan 430074, China
  • show less
    DOI: 10.18402/resci.2020.08.14 Cite this Article
    Zhe YOU, Jinhua Cheng, Tong WU, Ran WANG. Influence of pricing mechanism transferring on iron ore price volatility[J]. Resources Science, 2020, 42(8): 1604 Copy Citation Text show less
    Graph of discontinuity regression
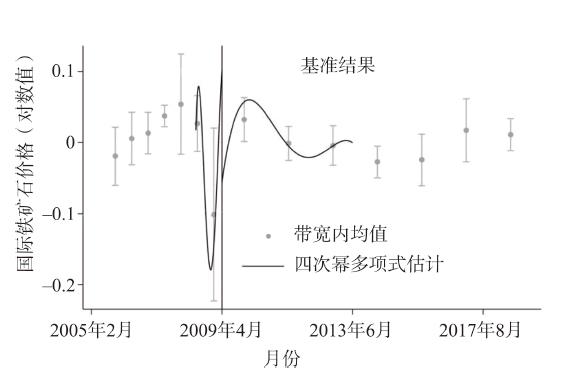
    Fig. 1. Graph of discontinuity regression
    Manipulation test for execution variables
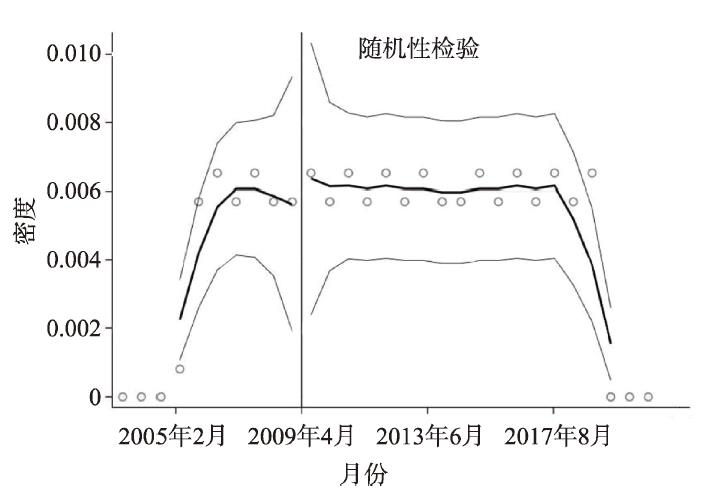
    Fig. 2. Manipulation test for execution variables
    一级指标二级指标三级指标/单位代码计算方法数据来源
    铁矿石价格国内铁矿石进口价格澳大利亚61.5%粉矿青岛港价格/(元/t)dIP_index一阶对数差分西本数据库
    国际铁矿石价格普氏62%铁矿石指数dP_mudi一阶对数差分西本数据库
    供需因素长期铁矿石需求国内生产总值增速/%dGDP一阶对数差分世界银行
    长期铁矿石供给国产矿产量/tdIOP一阶对数差分西本数据库
    短期铁矿石供给进口铁矿石港口库存/tdIS一阶对数差分西本数据库
    短期铁矿石需求铁矿石进口量/tdIM一阶对数差分联合国贸易数据库
    短期铁矿石供给国内粗钢产量/tdCSP一阶对数差分西本数据库
    金融因素资本市场因素标准普尔500股票指数dbp500一阶对数差分WIND数据库
    汇率变动因素美元兑人民币汇率dER一阶对数差分世界银行
    运输因素运输成本因素波罗的海干散货指数dBDI一阶对数差分西本数据库
    Table 1. Variable selection
    LwaldLwald200Lwald250Lwald300
    Lwald200-0.0606***(-0.0029)-0.180***(-0.0595)0.127(-0.4436)-0.0707(-0.0454)
    N164164164164
    Table 2. Basic regression results
    控制变量影响
    铁矿石进口量-0.0109(0.0377)
    国产矿产量0.0274(0.0358)
    标普500指数0.177(0.1236)
    进口铁矿石港口库存-0.0862*(0.0390)
    国内生产总值-0.0762(0.1361)
    国内粗钢产量-0.0546(0.0959)
    美元兑人民币汇率-0.846(0.6176)
    波罗的海干散货指数-0.0148(0.0198)
    N164
    Table 3. Regression coefficients of control variables on iron ore import prices
    (1)(2)
    Lwald-0.238**(0.0861)-0.0606***(0.0029)
    Lwald50-0.0482--0.0482-
    Lwald200-0.238**(0.0861)-0.180**(0.0595)
    N164164
    Table 4. Results of bandwidth sensitivity test
    dCSPdBDIdERdIMdIOPdIS
    Conventional-0.0518(-0.0545)-0.359(-0.4835)-0.00149*(-0.0009)-0.0979(-0.123)0.0769(-0.1247)0.079(-0.153)
    Bias-corre~d-0.0671(-0.0545)-0.498(-0.4835)-0.00255***(-0.0009)-0.112(-0.123)0.0812(-0.1247)0.0635(-0.153)
    Robust-0.0671(-0.0638)-0.498(-0.5465)-0.00255***(-0.0009)-0.112(-0.1459)0.0812(-0.151)0.0635(-0.1827)
    N164164164164164164
    Table 5. Results of continuity test
    (1)(2)
    Lwald-0.238**(0.0861)-0.0529 -
    Lwald250-0.129(0.0658)- -
    Lwald50- --0.0482 -
    Lwald200- --1.051 -
    N164164
    Table 6. Regression results after introducing key covariates and forward terms
    (1)(2)(3)(4)(5)(6)
    Conventional0.0849(0.0704)-0.044(0.1064)0.000238(0.0981)0.102(0.0813)-0.128(0.1312)-0.102(0.1191)
    Bias-corre~d0.0819(0.0704)-0.0792(0.1064)-0.0263(0.0981)0.101(0.0813)-0.151(0.1312)-0.119(0.1191)
    Robust0.0819(0.0839)-0.0792(0.1248)-0.0263(0.1146)0.101(0.0898)-0.151(0.1449)-0.119(0.1313)
    N164164164164164164
    Table 7. Results of Non-parametric test
    (1)(2)
    Lwald0.289**(0.1007)0.164(0.1001)
    Lwald 2000.289**(0.1007)0.205*(0.0928)
    Lwald 2500.113(0.1296)0.102(0.0919)
    Lwald 3000.0104(0.1146)0.101(0.0834)
    N164164
    Table 8. Basic regression results for international iron ore price impact mechanism
    (1)(2)(3)(4)(5)(6)
    Conventional0.113(0.1082)0.0969(0.0933)0.103(0.1007)0.289*(0.1316)0.208*(0.0998)0.247*(0.1067)
    Bias-corre~d0.0628(0.1082)0.0622(0.0933)0.0642(0.1007)0.252(0.1316)0.185(0.0998)0.220*(0.1067)
    Robust0.0628(0.1245)0.0622(0.1200)0.0642(0.1296)0.252(0.1433)0.185(0.1168)0.220(0.1241)
    N164164164164164164
    Table 9. Results of Non-parametric test for international iron ore price impact mechanism
    Zhe YOU, Jinhua Cheng, Tong WU, Ran WANG. Influence of pricing mechanism transferring on iron ore price volatility[J]. Resources Science, 2020, 42(8): 1604
    Download Citation