• Acta Physica Sinica
  • Vol. 69, Issue 16, 164201-1 (2020)
Yi-Yi Zhang1、2, Jia-Chen Wu3, Ran Hao1、2, Shang-Zhong Jin1、2、*, and Liang-Cai Cao3、*
Author Affiliations
  • 1College of Optical and Electronic Technology, China Jiliang University, Hangzhou 310018, China
  • 2Key Laboratory of Zhejiang Province on Modern Measurement Technology and Instruments, Hangzhou 310018, China
  • 3State Key Laboratory of Precision Measurement Technology and Instruments, Tsinghua University, Beijing 100084, China
  • show less
    DOI: 10.7498/aps.69.20200357 Cite this Article
    Yi-Yi Zhang, Jia-Chen Wu, Ran Hao, Shang-Zhong Jin, Liang-Cai Cao. Digital holographic microscopy for red blood cell imaging[J]. Acta Physica Sinica, 2020, 69(16): 164201-1 Copy Citation Text show less
    Optical layout of digital holography.
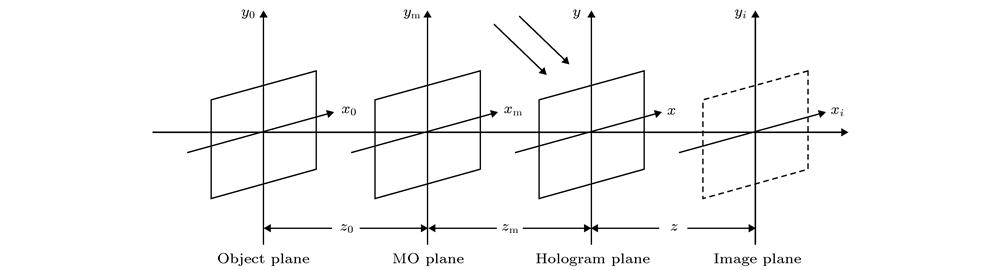
    Fig. 1. Optical layout of digital holography.
    Optical layout of digital holographic reconstruction.
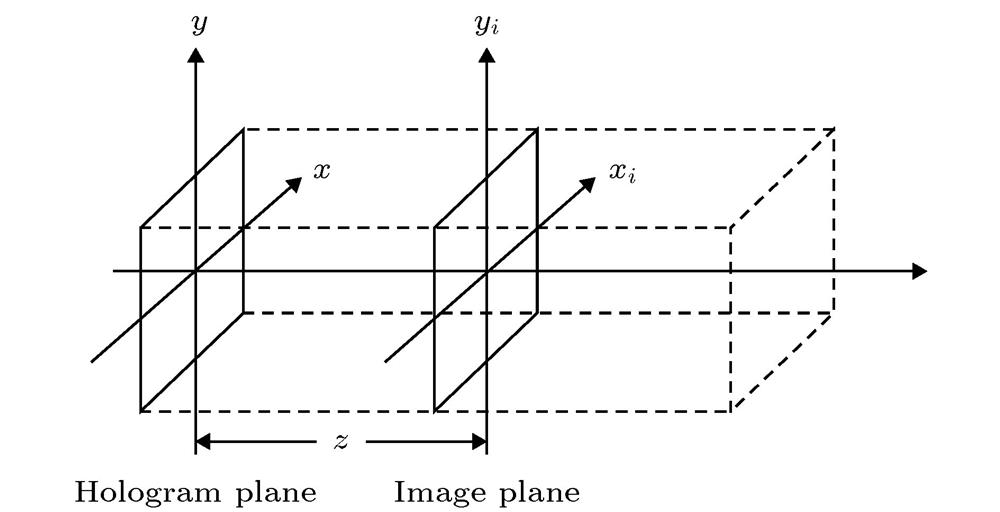
    Fig. 2. Optical layout of digital holographic reconstruction.
    Inline digital holographic microscopic system for detecting micro-deformation of RBC[52].
    Fig. 3. Inline digital holographic microscopic system for detecting micro-deformation of RBC[52].
    The relationship between the RBC deformation and the real part of reconstructed amplitude. (a) The reconstruction distance z' to the focus at different recording distances z of the simulated RBC (red) and the experiment using a real RBC (green). Inset shows the Cassini model of the RBC used in the simulations; (b) the experiment using a real RBC (green), the reconstructed Re(U) for the simulated unaltered RBC and a deformed RBC represented by the red and blue curves, respectively; (c) reconstructed data from a ~20% smaller RBC compared with the one used in (b). Red and green curves represent the Re(U) of simulation and experiment, respectively; Gray vertical line in (b) and (c) indicates position of the RBC[52].
    Fig. 4. The relationship between the RBC deformation and the real part of reconstructed amplitude. (a) The reconstruction distance z' to the focus at different recording distances z of the simulated RBC (red) and the experiment using a real RBC (green). Inset shows the Cassini model of the RBC used in the simulations; (b) the experiment using a real RBC (green), the reconstructed Re(U) for the simulated unaltered RBC and a deformed RBC represented by the red and blue curves, respectively; (c) reconstructed data from a ~20% smaller RBC compared with the one used in (b). Red and green curves represent the Re(U) of simulation and experiment, respectively; Gray vertical line in (b) and (c) indicates position of the RBC[52].
    Inline digital holographic microscopic system for tracking spatial distribution of RBCS[51].
    Fig. 5. Inline digital holographic microscopic system for tracking spatial distribution of RBCS[51].
    The hologram and the reconstruction images of RBCs. (a) The RBC hologram obtained from CMOS; (b), (c), and (d) represent RBC reconstruction images at different reconstruction depths, respectively. Each focused RBC is shown by an arrow[51].
    Fig. 6. The hologram and the reconstruction images of RBCs. (a) The RBC hologram obtained from CMOS; (b), (c), and (d) represent RBC reconstruction images at different reconstruction depths, respectively. Each focused RBC is shown by an arrow[51].
    Off-axis digital holographic microscopy system for measuring RBCs’ three-dimensional volume of different shapes[54].
    Fig. 7. Off-axis digital holographic microscopy system for measuring RBCs’ three-dimensional volume of different shapes[54].
    The reconstructed phase image for RBCs (a) The reconstructed phase image for RBCs having a stomatocyte shape; (b) the reconstructed RBCs phase image for RBCs having a discocyte shape; (c)the segmented phase image for RBCs having a stomatocyte shape; (d) the segmented phase image for RBCs having a discocyte shape; (e) the segmented phase image for single RBC(f), (g) and (h) represent the A, B and C parts by the marker-controlled watershed algorithm in RBC, respectively[54].
    Fig. 8. The reconstructed phase image for RBCs (a) The reconstructed phase image for RBCs having a stomatocyte shape; (b) the reconstructed RBCs phase image for RBCs having a discocyte shape; (c)the segmented phase image for RBCs having a stomatocyte shape; (d) the segmented phase image for RBCs having a discocyte shape; (e) the segmented phase image for single RBC(f), (g) and (h) represent the A, B and C parts by the marker-controlled watershed algorithm in RBC, respectively[54].
    Off-axis digital holographic microscopy system for investigating the effect of defocus on RBC three-dimensional volume measurement[53].
    Fig. 9. Off-axis digital holographic microscopy system for investigating the effect of defocus on RBC three-dimensional volume measurement[53].
    Digital refocusing of a single red blood cell image and corresponding optical volume measurements. (a) The amplitude and phase images by the manually-focused method and digitally-refocused method from a single RBC; (b) amplitude variance metric of holograms A-G; (c) computed OV of RBC from manually-focused phase images(black) and digitally-refocused phase images(blue). OV reported as mean ± standard deviation[53].
    Fig. 10. Digital refocusing of a single red blood cell image and corresponding optical volume measurements. (a) The amplitude and phase images by the manually-focused method and digitally-refocused method from a single RBC; (b) amplitude variance metric of holograms A-G; (c) computed OV of RBC from manually-focused phase images(black) and digitally-refocused phase images(blue). OV reported as mean ± standard deviation[53].
    Off-axis digital holographic microscopy system with optical tweezer for measuring RBCs’ three-dimensional volume[72].
    Fig. 11. Off-axis digital holographic microscopy system with optical tweezer for measuring RBCs’ three-dimensional volume[72].
    Height change of reconstructed RBCs under different concentrations of oxidative stress (0−200 μmol/L). Four images in each group are corresponding to trap force varying from 0−3 pN. Color bar represents different thickness[72].
    Fig. 12. Height change of reconstructed RBCs under different concentrations of oxidative stress (0−200 μmol/L). Four images in each group are corresponding to trap force varying from 0−3 pN. Color bar represents different thickness[72].
    Performance of RBC under different oxidative stress. (a) The relationship between the maximum height H of RBC and the trap tensile force under different oxidative stress; (b) the volume of RBC under different oxidative stress[72].
    Fig. 13. Performance of RBC under different oxidative stress. (a) The relationship between the maximum height H of RBC and the trap tensile force under different oxidative stress; (b) the volume of RBC under different oxidative stress[72].
    坐标测量精度/μm均方根误差/μm
    $x$± 0.30.63
    $y$± 0.30.52
    $z$± 1.02.05
    Table 1.

    The lateral and axial measurement accuracy of RBC[51].

    RBC横向信息与轴向信息的测量精度[51]

    A部分B部分
    平均体积/μm3均方根 误差 平均体积/μm3均方根 误差
    口腔状7.67.241.514.7
    盘状14.68.032.77.3
    Table 2.

    The different shapes of RBC’s three-dimensional volume of A and B parts.

    两种不同形状RBC的A、B部分的三维体积

    测量方法光学体积/fL误差比/%
    人工聚焦方法281.75.90
    数字重聚焦方法266.60.22
    真实值266.0 ± 7.980.00
    Table 3.

    Comparison of OV measured by manually-focused and digitally-refocused methods[53].

    人工聚焦方法与数字重聚焦方法测得微球光学体积对比[53]

    Yi-Yi Zhang, Jia-Chen Wu, Ran Hao, Shang-Zhong Jin, Liang-Cai Cao. Digital holographic microscopy for red blood cell imaging[J]. Acta Physica Sinica, 2020, 69(16): 164201-1
    Download Citation