
Liyun Wu, Zhanyong Zhao, Peikang Bai. Effect of GNPs Content on Microstructure and Strengthening Mechanism of GNPs/AlSi10Mg Composite Fabricated by Selective Laser Melting[J]. Chinese Journal of Lasers, 2023, 50(16): 1602307
- Chinese Journal of Lasers
- Vol. 50, Issue 16, 1602307 (2023)
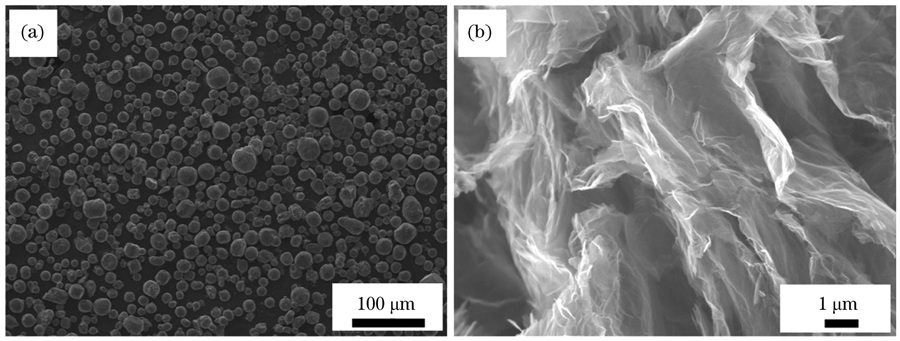
Fig. 1. Morphology of raw materials. (a) Morphology of AlSi10Mg powder captured by scanning electron microscope (SEM);(b) morphology of GNPs captured by SEM
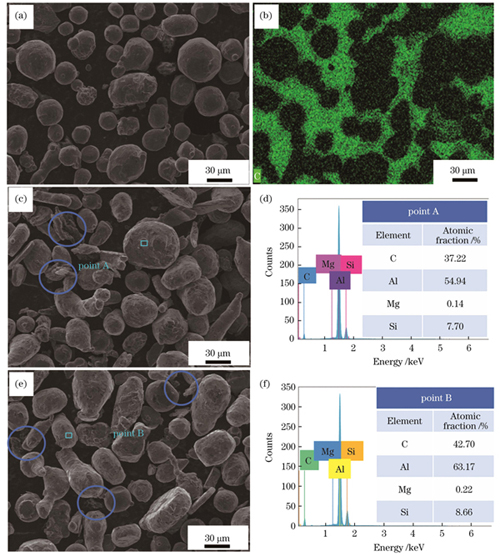
Fig. 2. Morphology and composition analysis of GNPs/AlSi10Mg composite powders. (a) SEM morphology of 0.1%GNPs/AlSi10Mg; (b) carbon element distribution map of 0.1%GNPs/AlSi10Mg; (c) SEM morphology of 0.3%GNPs/AlSi10Mg; (d) composition analysis of 0.3%GNPs/AlSi10Mg; (e) SEM morphology of 0.5%GNPs/AlSi10Mg; (f) composition analysis of 0.5%GNPs/AlSi10Mg
Fig. 3. Size of tensile specimen. (a) Schematic diagram; (b) physical image
Fig. 4. EBSD inverse pole figure (IPF) maps, distributions of the grain size and the pole figures (PFs) of AlSi10Mg alloy and 0.5%GNPs/AlSi10Mg composite. (a)(c) AlSi10Mg alloy; (b)(d) 0.5%GNPs/AlSi10Mg composite
Fig. 5. Grain boundary misorientation difference distribution images and proportion diagrams of HAGB of AlSi10Mg alloy and 0.5%GNPs/AlSi10Mg composite. (a)(c) AlSi10Mg alloy; (b)(d) 0.5%GNPs/AlSi10Mg composite
Fig. 6. Cross-sectional SEM morphology of GNPs/AlSi10Mg composites. (a)(b) AlSi10Mg alloy; (c)(d) 0.1%GNPs/AlSi10Mg composite; (e)(f) 0.3%GNPs/AlSi10Mg composite; (g)(h) 0.5%GNPs/AlSi10Mg composite
Fig. 7. X-ray diffraction patterns and hardness histogram of AlSi10Mg alloy and GNPs/AlSi10Mg composites. (a) X-ray diffraction patterns; (b) hardness histogram
Fig. 8. Tensile properties of AlSi10Mg alloy and GNPs/AlSi10Mg composites. (a) Stress-strain curves; (b) tensile properties
Fig. 9. Fracture morphology of AlSi10Mg alloy and GNPs/AlSi10Mg composites
Fig. 10. Relationship between ultimate tensile strength and ductility
Fig. 11. Schematic diagrams of the strengthening mechanism of graphene. (a) Before tensile experiment; (b) after tensile experiment
|
Table 1. Chemical composition of AlSi10Mg powder
|
Table 2. Selective laser melting process parameters
|
Table 3. Tensile properties of AlSi10Mg alloy and GNPs/AlSi10Mg composites
| |||||||||||||||||||||||||||||
Table 4. EDS analysis of different locations in the composites showed in Fig.9

Set citation alerts for the article
Please enter your email address
© Copyright 2018-2021 | Chinese Laser Press. All Rights Reserved 沪ICP备15018463号-20