
Xin Xu, Xue-Ying Jin, Hao-Ran Gao, Jie Cheng, Yang Lu, Dong Chen, Lian-Dong Yu. Analysis of frequency tuning process of dual coupled optical microcavities [J]. Acta Physica Sinica, 2020, 69(18): 184207-1
- Acta Physica Sinica
- Vol. 69, Issue 18, 184207-1 (2020)
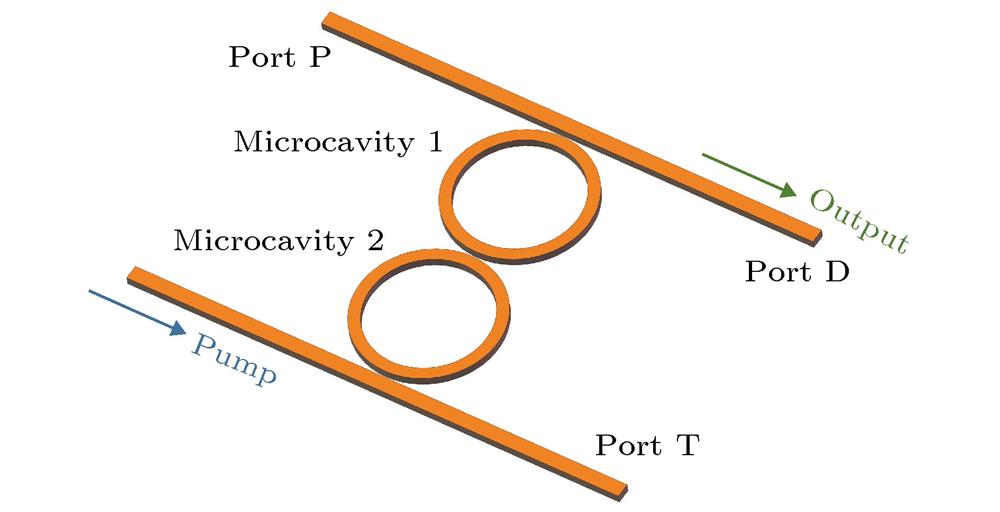
Fig. 1. Structure of the dual coupled optical microcavities.
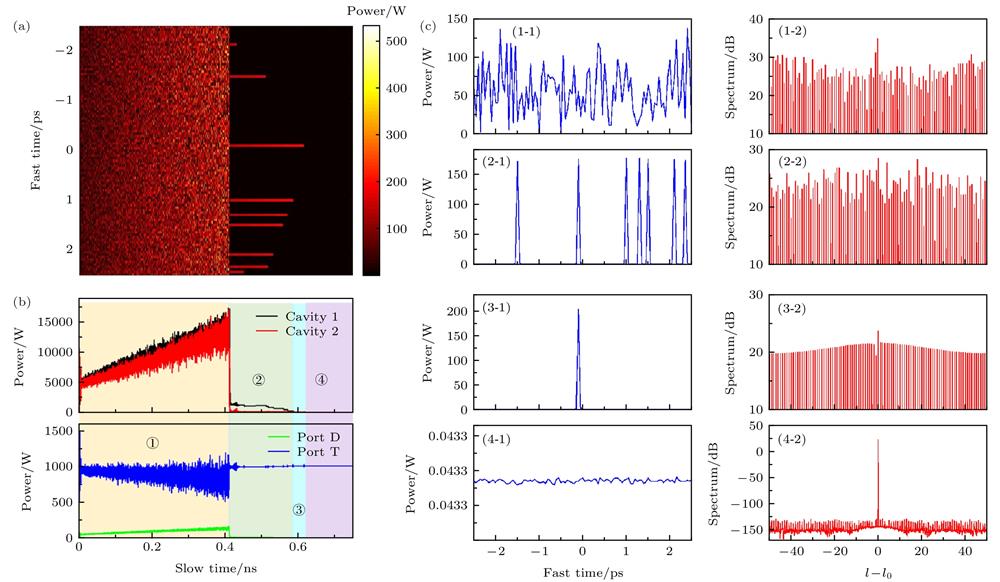
Fig. 2. (a) Evolution of the optical field inside the first microcavity in the region of positive frequency tuning; (b) curves of the optical power variation in the process of frequency tuning; (c) field distribution and spectra corresponding to each stage in Fig. (b).
Fig. 3. (a) Evolution of the optical field inside the first microcavity in the process of negative frequency tuning; (b) curves of the optical power variation in the process of frequency tuning; (c) field distribution and spectra corresponding to each stage in Fig. (b).
Fig. 4. (a) Evolution of the optical field inside the first microcavity with strong coupling in the region of positive frequency tuning; (b) evolution of the optical field inside the first microcavity with strong coupling in the region of negative frequency tuning.
Fig. 5. (a) Evolution of the stable existence of bright soliton in the microcavity (δ 1 = 1.201 × 10² m–1, δ 2 = 8.809 m–1, P in = 1 W); (b) field distribution of the bright soliton; (c) spectrum of the bright soliton; (d) curves of the dual power inside the dual coupled microcavities vary with the slow time; (e) curves of the dual power of Port D and T vary with the slow time.
Fig. 6. (a) Evolution of a bright soliton to a multi-pulse optical field (δ 2 = 16.1411 m–1, the initial value of Δf 1 is 770 GHz, and the change speed of Δf 1 is 2.73 GHz/μs, P in = 1 W); (b) spectrum of the multi-pulse; (c) curves of the dual power inside the dual coupled microcavities vary with the slow time; (d) curves of the dual power of Port D and T vary with the slow time.


Set citation alerts for the article
Please enter your email address

© Copyright 2018-2021 | Chinese Laser Press. All Rights Reserved 沪ICP备15018463号-20