
Haiyan Ou, Ting-Chung Poon, Kenneth K. Y. Wong, and Edmund Y. Lam, "Enhanced depth resolution in optical scanning holography using a configurable pupil," Photonics Res. 2, 64 (2014)
- Photonics Research
- Vol. 2, Issue 2, 64 (2014)
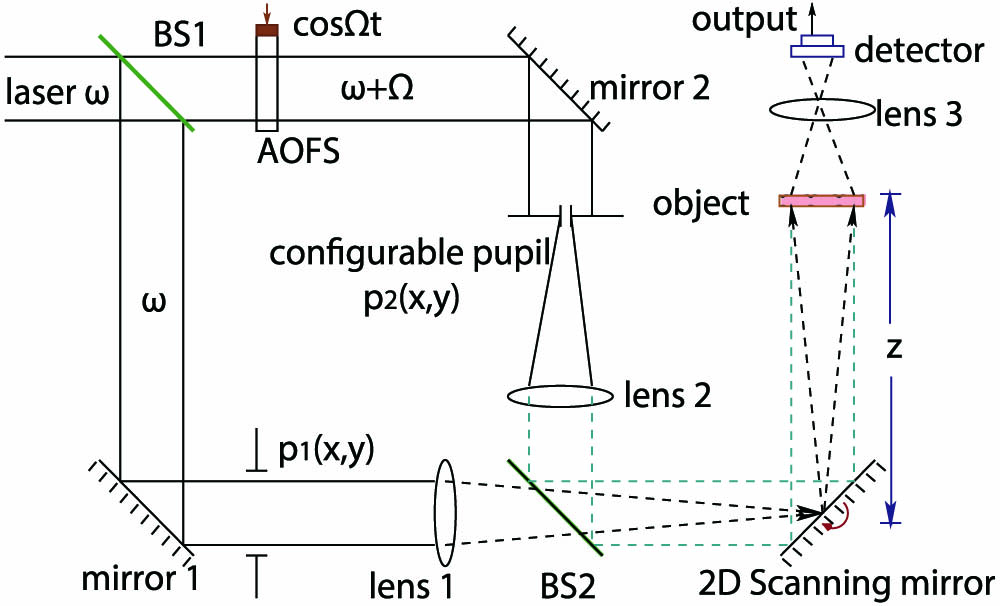
Fig. 1. Schematic of OSH.
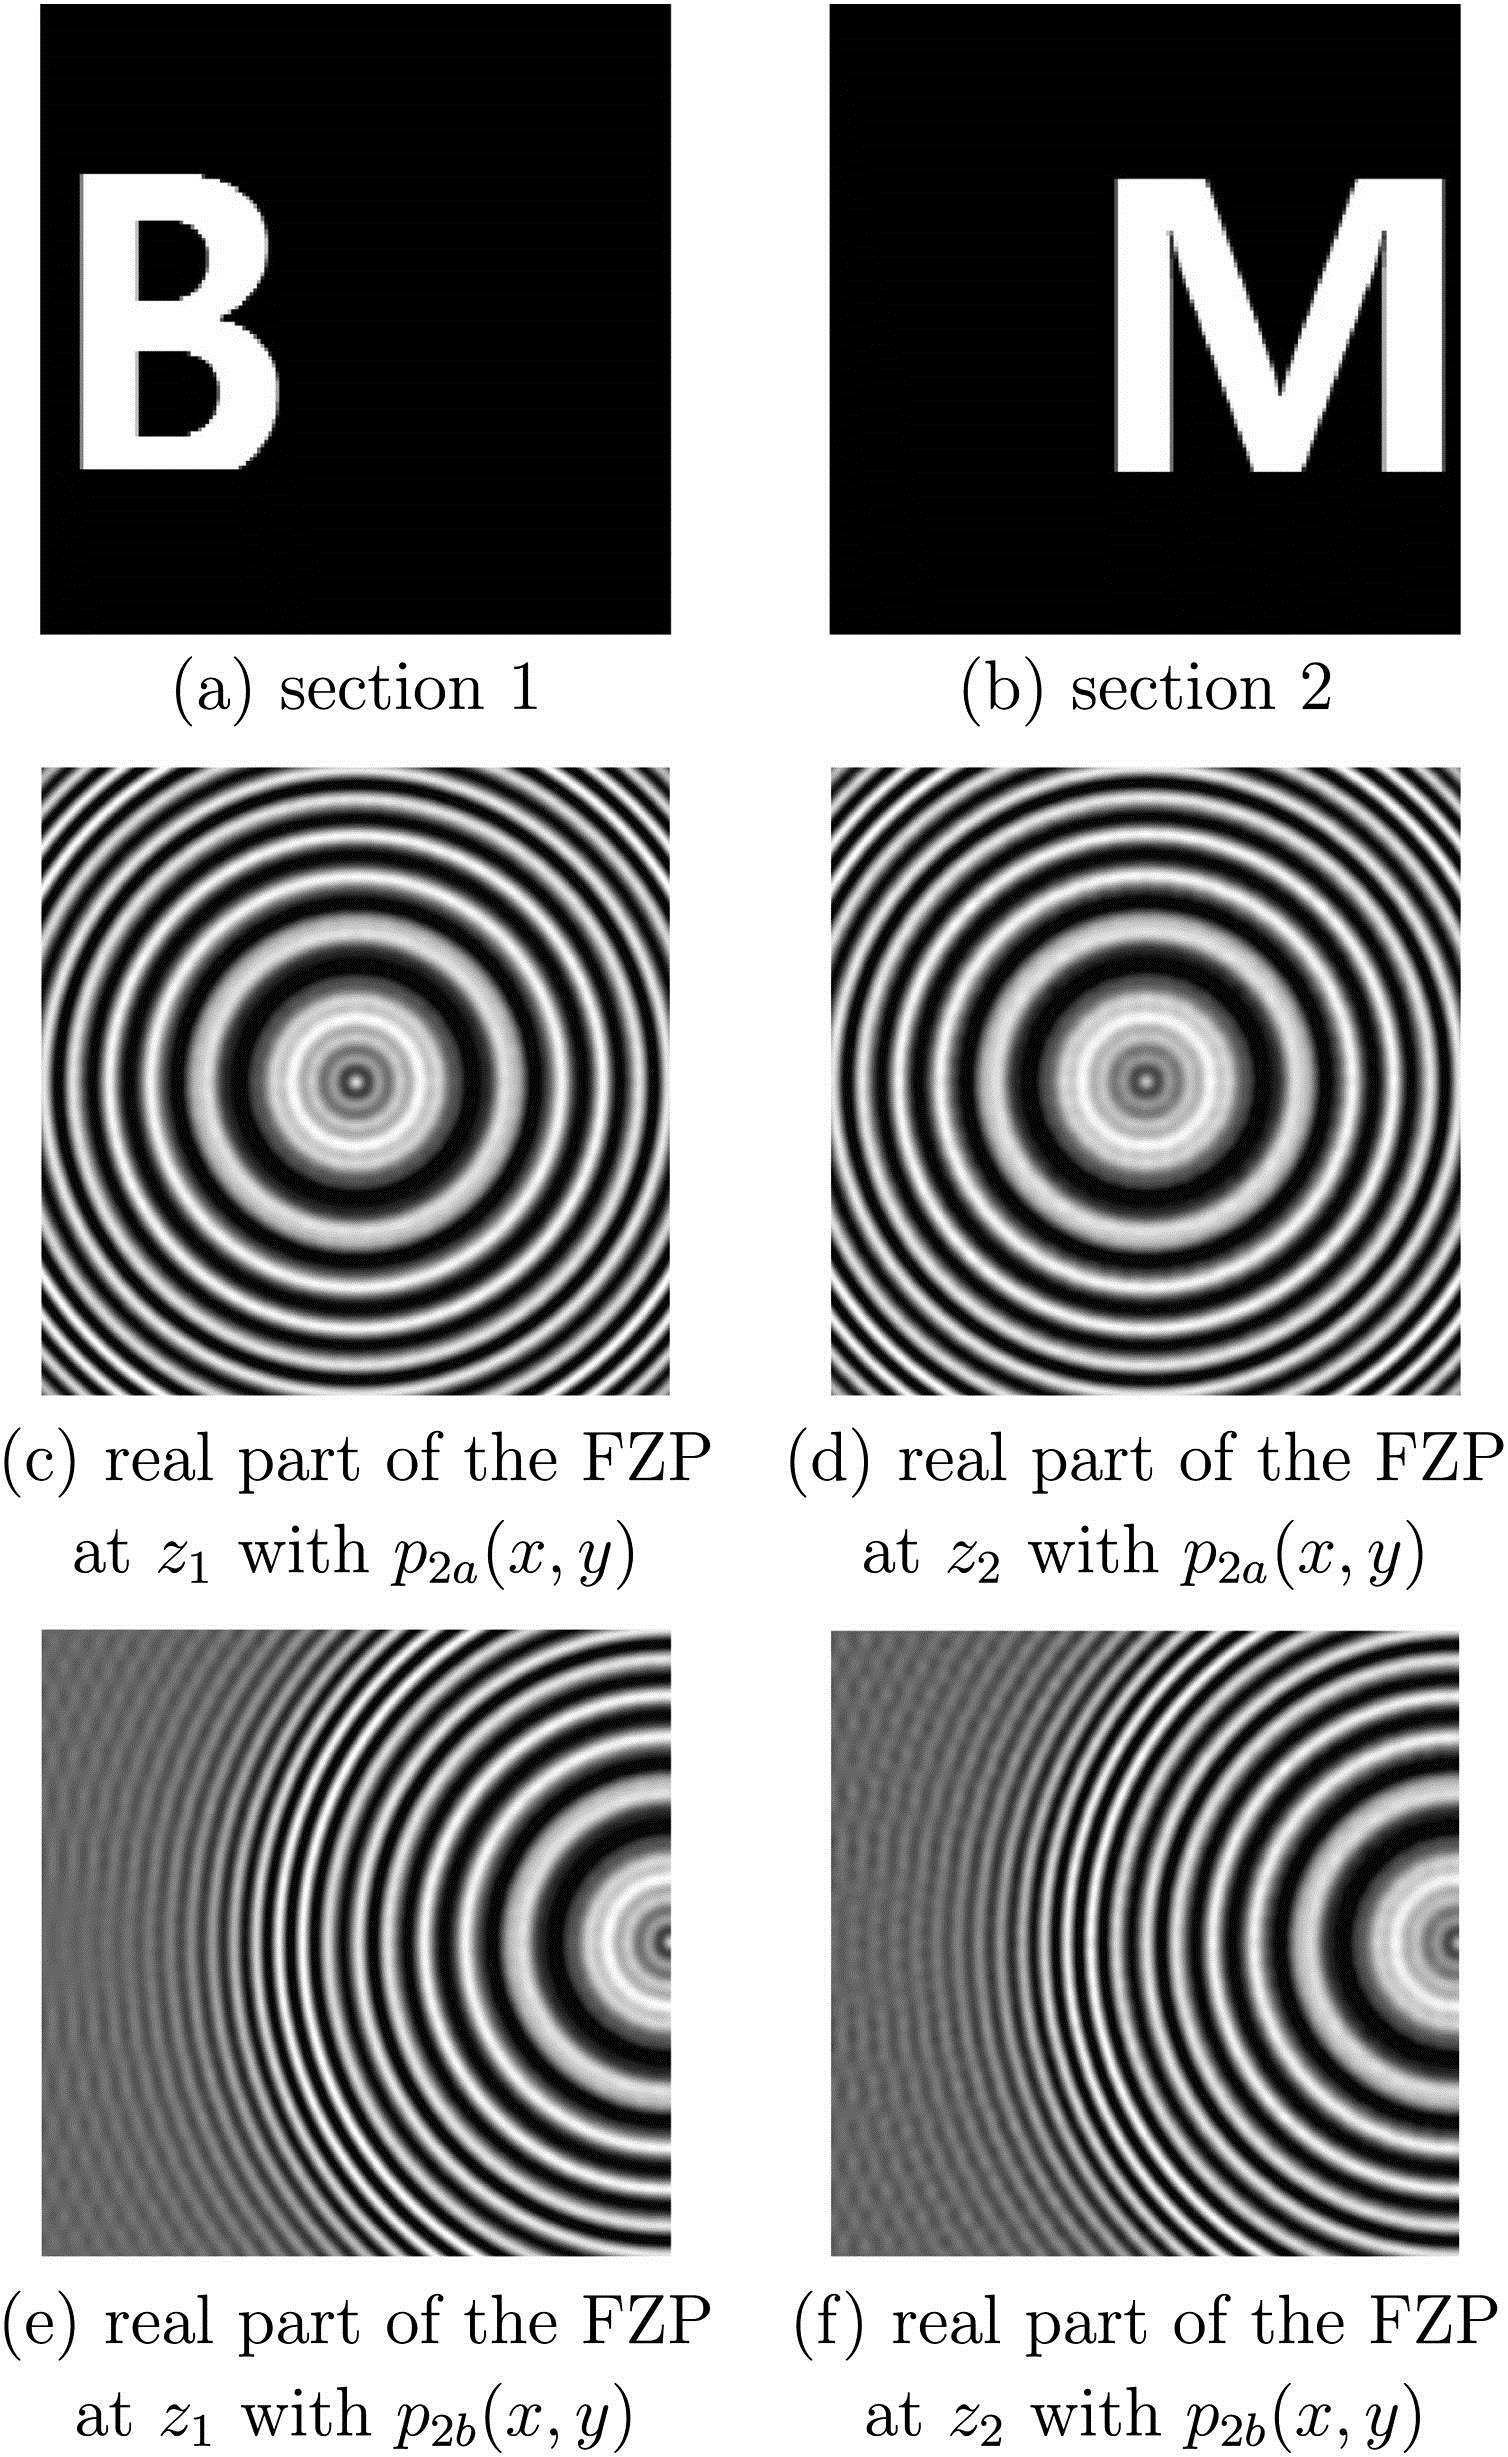
Fig. 2. Two sections together with the real part of the FZPs for each scan.
Fig. 3. Holograms containing two-sectional images of the object with different pupil functions (a), (b) for x 0 = y 0 = 0 x 0 = 0.48 mm y 0 = 0
Fig. 4. Sectioning results using (a), (b) the conventional method; (c), (d) the conjugate-gradient-based method with a single measurement; (e), (f) the conjugate-gradient-based method with the proposed method.
Fig. 5. Relationship between x 0 x 0 H 1 H 2
Fig. 6. Relationship between spatial shift and the correlation of H 1 H 2
Fig. 7. Relationship between spatial shift and resolution.
Fig. 8. Object with three sections.
Fig. 9. Holograms containing three-section images of the object with different pupil functions (a), (b) for x 0 = y 0 = 0 x 0 = 0.48 mm y 0 = 0
Fig. 10. Sectioning results using (a)–(c) the conventional method; (d)–(f) the conjugate-gradient-based method with a single measurement; (g)–(i) the conjugate-gradient-based method with the proposed method.
Fig. 11. Sectioning results using the proposed method with (a)–(b) Δ x = 0 nm z 1 = 34 mm z 2 = 34.0007 mm Δ x = 100 nm z 1 = 34 mm z 2 = 34.0007 mm Δ x = 100 nm z 1 = 34 mm z 2 = 34.01 mm
Fig. 12. Relationship between measurement error and the depth resolution.


Set citation alerts for the article
Please enter your email address

© Copyright 2018-2021 | Chinese Laser Press. All Rights Reserved 沪ICP备15018463号-20