• Chinese Optics Letters
  • Vol. 14, Issue 4, 042201 (2016)
Berta García-Fernández1、*, Antonio Álvarez Fernández-Balbuena1、2, and Daniel Vázquez-Moliní1
Author Affiliations
  • 1Department of Optics, Faculty of Optics and Optometry, University Complutense of Madrid, Madrid 28040, Spain
  • 2Department of Forest and Environmental Engineering and Management, School of Forestry Engineering, Polytechnic University of Madrid, Madrid 28040, Spain
  • show less
    DOI: 10.3788/COL201614.042201 Cite this Article Set citation alerts
    Berta García-Fernández, Antonio Álvarez Fernández-Balbuena, Daniel Vázquez-Moliní. Analytical method to measure bending deformations in prismatic optical films[J]. Chinese Optics Letters, 2016, 14(4): 042201 Copy Citation Text show less
    Image of a cross section of the prism film used to analyze the contour (57×).
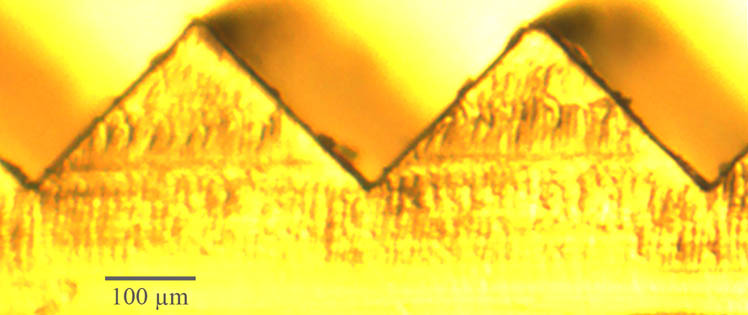
    Fig. 1. Image of a cross section of the prism film used to analyze the contour (57×).
    Edge map (black color) with Hough lines identified (red color) in a prismatic film profile with a curvature of 20 m−1.
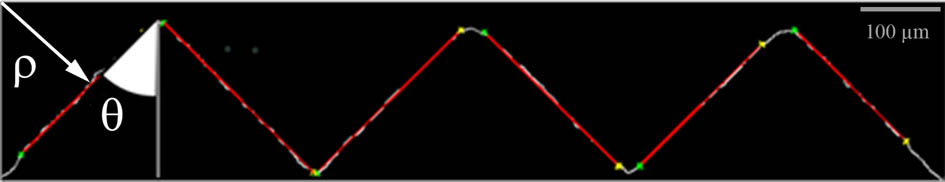
    Fig. 2. Edge map (black color) with Hough lines identified (red color) in a prismatic film profile with a curvature of 20m1.
    The HT of the three-prism image of a prismatic film curvature of 20 m−1 with the Hough peak identified. The red square shows the peaks of data in the Hough matrix and indicates ρ, the perpendicular distance from the origin to the line and θ is the angle at which the sum of the intensities in the image peaks.
    Fig. 3. The HT of the three-prism image of a prismatic film curvature of 20m1 with the Hough peak identified. The red square shows the peaks of data in the Hough matrix and indicates ρ, the perpendicular distance from the origin to the line and θ is the angle at which the sum of the intensities in the image peaks.
    Angle θ obtained by HT related to the CPLG curvature. The graph legend shows the curvatures evaluated in m−1. Global changes in the prismatic angle related to the Hough peaks are shown in (a) and local changes in prism half-angle in (b).
    Fig. 4. Angle θ obtained by HT related to the CPLG curvature. The graph legend shows the curvatures evaluated in m1. Global changes in the prismatic angle related to the Hough peaks are shown in (a) and local changes in prism half-angle in (b).
    Experimental setup for the transmittance measurements (upper view).
    Fig. 5. Experimental setup for the transmittance measurements (upper view).
    Light flux rate (rate of flux lost) scaled from 0 to 1.0 as a function of the curvature of a CPLG for several incidence angles. The graph legend shows incidence angles with regard to the prismatic film flat surface.
    Fig. 6. Light flux rate (rate of flux lost) scaled from 0 to 1.0 as a function of the curvature of a CPLG for several incidence angles. The graph legend shows incidence angles with regard to the prismatic film flat surface.
    Flux loss rate obtained in tridimensional simulations of CPLG guides with curvatures of (a) 8.00 and (b) 57.14.
    Fig. 7. Flux loss rate obtained in tridimensional simulations of CPLG guides with curvatures of (a) 8.00 and (b) 57.14.
    Berta García-Fernández, Antonio Álvarez Fernández-Balbuena, Daniel Vázquez-Moliní. Analytical method to measure bending deformations in prismatic optical films[J]. Chinese Optics Letters, 2016, 14(4): 042201
    Download Citation