
Bin He, Xiong He, Guo-Qiang Liu, Can Zhu, Jia-Fu Wang, Zhi-Gang Sun. Memristive and magnetoresistance effects of SnSe2 [J]. Acta Physica Sinica, 2020, 69(11): 117301-1
- Acta Physica Sinica
- Vol. 69, Issue 11, 117301-1 (2020)
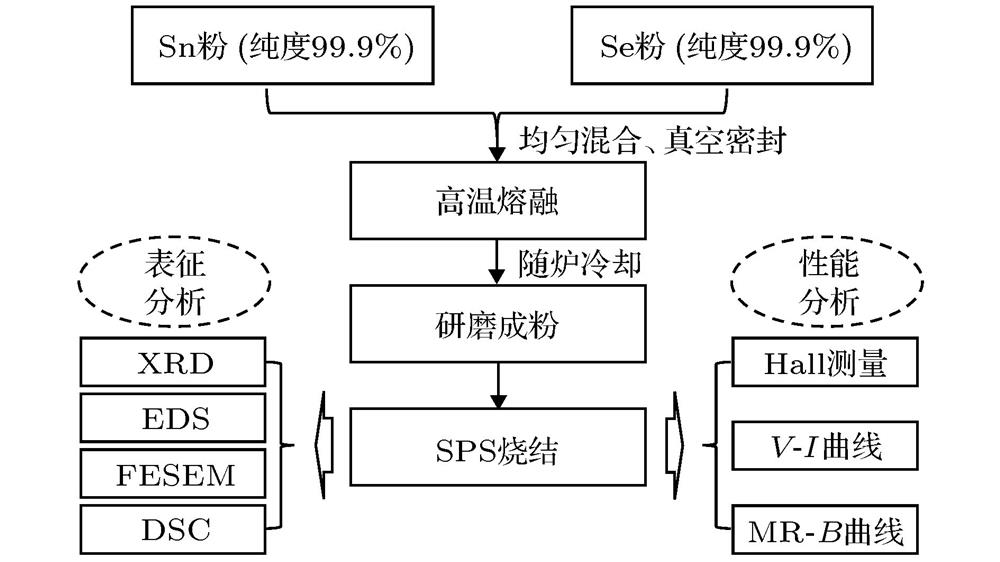
Fig. 1. Preparation processes of the bulk SnSe2.
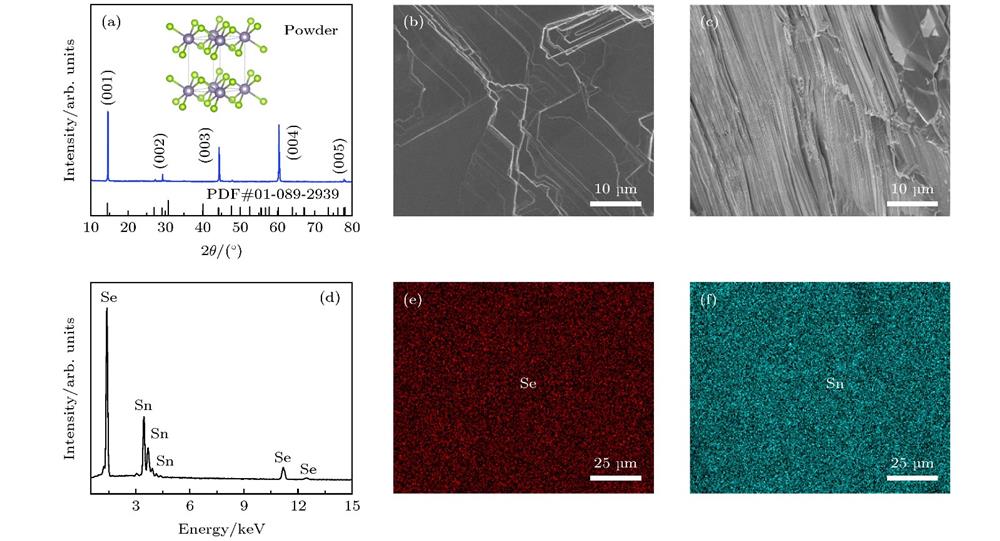
Fig. 2. (a) XRD patterns of SnSe2, the inset is the crystal structure of the SnSe2; (b) and (c) FESEM images of the fresh fracture surface of SnSe2 after SPS synthesis; (d) EDS spectrum of SnSe2; (e) the Se elemental map and (f) the Sn elemental map.
Fig. 3. Temperature dependence (10−300 K) of the resistivity (a) and carrier concentration and mobility (b).
Fig. 4. (a) V -I characteristic curves of SnSe2 with current sweep as –100 mA → 0 → 100 mA → 0 → –100 mA for 3 times at 300 K, the inset shows the schematic of the device; (b) V -I characteristic curves of SnSe2 with current sweep as –100 mA → 0 → 100 mA → 0 → –100 mA for 3 times at 10 K.
Fig. 5. (a) V -I characteristic curves of SnSe2 in current sweep as 0 mA → 100 mA → 0 mA at ambient temperature 285 K, the inset shows the ultrared detection diagram of the device directly exchanging heat with air; (b) temperature distribution maps of the sample at temperature points A , B and C in (a); (c) the DSC curves of SnSe2.
Fig. 6. lgV -lgI curves in negative bias region (a) and positive bias region (b) at 300 K, respectively; lgV -lgI curves in in negative bias region (c) and positive bias region (d) at 10 K, respectively.
Fig. 7. V -I characteristic curves under different magnetic fields at 300 K (a), 200 K (c), 100 K (e) and 10 K (g), respectively; lgV -lgI characteristic curves under different magnetic fields at 300 K (b), 200 K (d), 100 K (f) and 10 K (h), respectively. The insets in (b) and (d) show the magnified parts of curves.
Fig. 8. (a) Electron motion process dominated by lattice scattering; (b) influence of magnetic field on the electron motion process dominated by lattice scattering; (c) electron localization process dominated by impurity scattering; (d) influence of magnetic field on the electron localization process dominated by impurity scattering.
Fig. 9. (a) MR -B curves in different regions at 100 K; (b) MR -B curves in different regions at 10 K.

Set citation alerts for the article
Please enter your email address
© Copyright 2018-2021 | Chinese Laser Press. All Rights Reserved 沪ICP备15018463号-20