• High Power Laser and Particle Beams
  • Vol. 34, Issue 1, 011012 (2022)
Xun Zhou1、2, Qiong Ma1, Zhibo Liu1, and Hongxiang Kang1、*
Author Affiliations
  • 1Institute of Radiation Medicine, Academy of Military Medical Science, Academy of Military Science PLA China, Beijing100850, China
  • 2Information and Communication Engineering College, North University of China, Taiyuan 030051, China
  • show less
    DOI: 10.11884/HPLPB202234.210338 Cite this Article
    Xun Zhou, Qiong Ma, Zhibo Liu, Hongxiang Kang. 1064 nm laser induced thermal injure in mice skin with different laser duration[J]. High Power Laser and Particle Beams, 2022, 34(1): 011012 Copy Citation Text show less
    Light path diagram of 1064 nm laser radiation on living mice skin
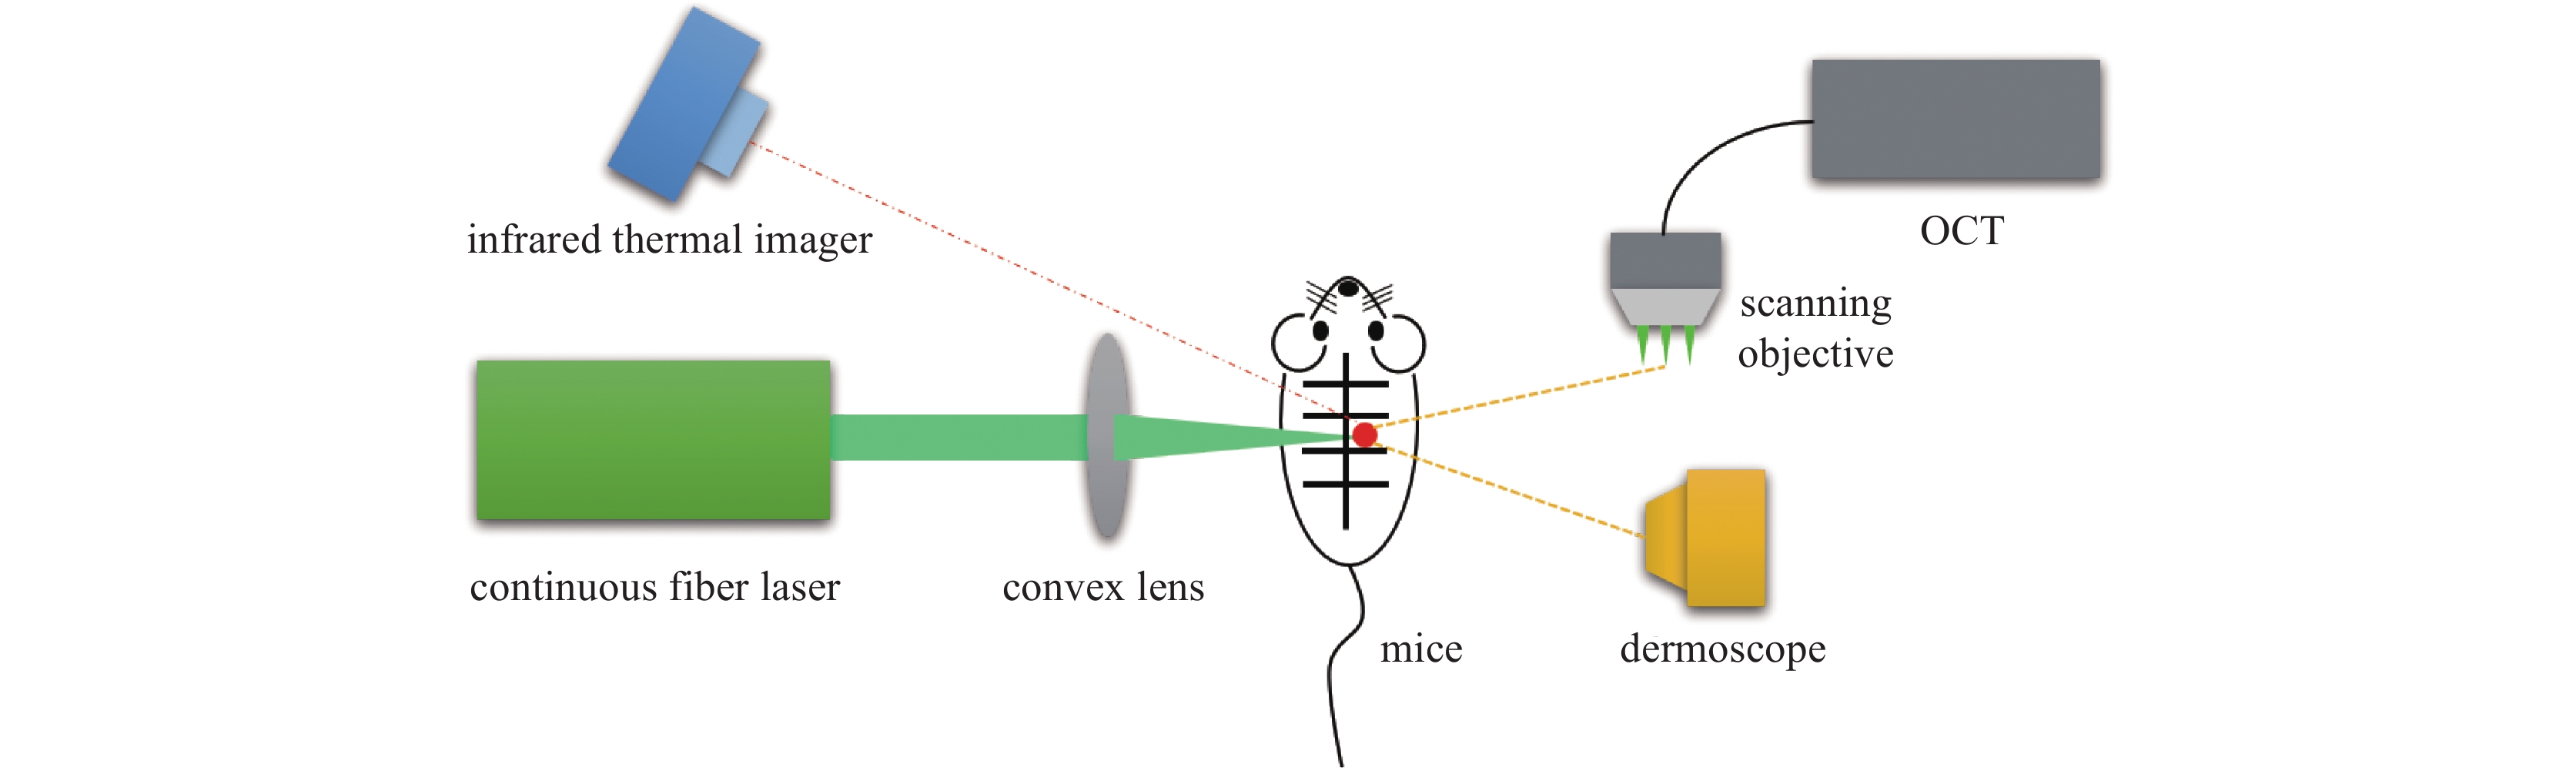
    Fig. 1. Light path diagram of 1064 nm laser radiation on living mice skin
    Dermoscope images of injure in mice skin at different duration of 1064 nm laser irradiation(a: 60 ms, b: 100 ms, c: 150 ms, d: 210 ms, e: 280 ms, f: 360 ms, g: 550 ms, h: 660 ms, i: 780 ms. Scale bar of dermoscope images: 500 μm)
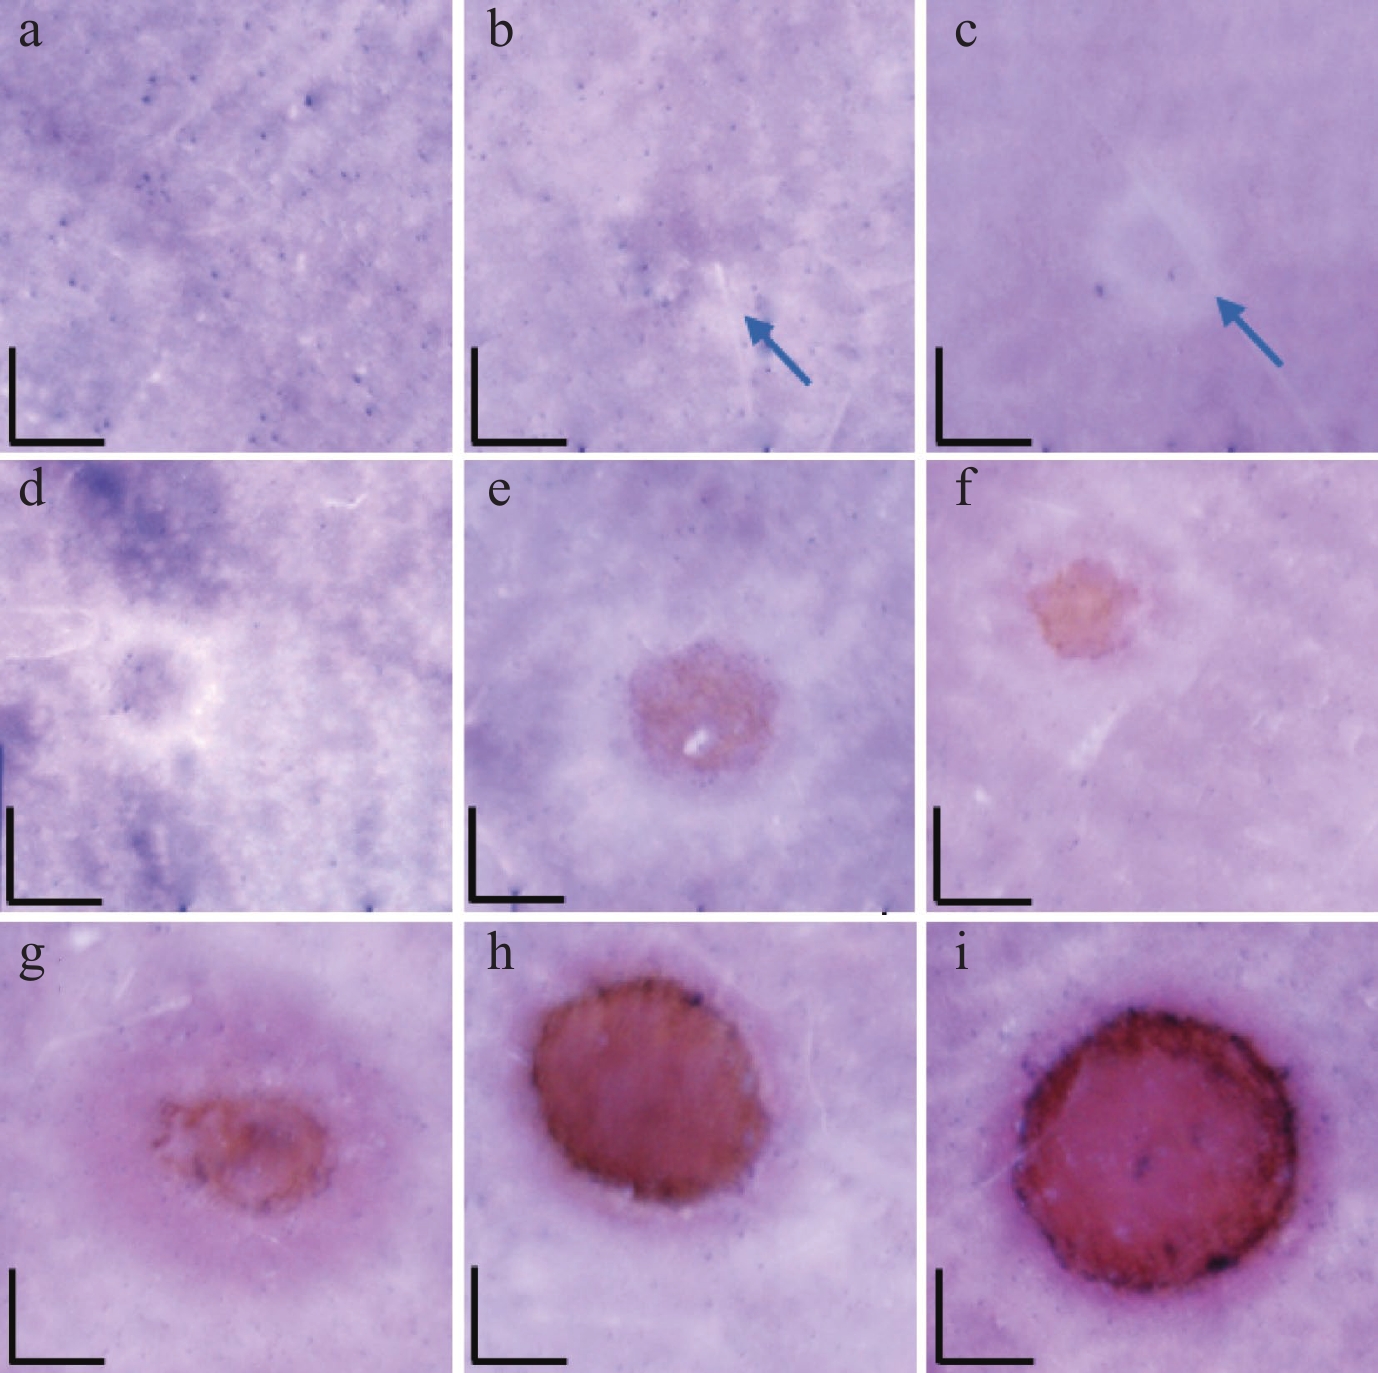
    Fig. 2. Dermoscope images of injure in mice skin at different duration of 1064 nm laser irradiation(a: 60 ms, b: 100 ms, c: 150 ms, d: 210 ms, e: 280 ms, f: 360 ms, g: 550 ms, h: 660 ms, i: 780 ms. Scale bar of dermoscope images: 500 μm)
    Relationship between laser duration and area of damage spot
    Fig. 3. Relationship between laser duration and area of damage spot
    OCT images of injure in mice skin at different duration of 1064 nm laser irradiation (a: 60 ms, b: 100 ms, c: 150 ms, d: 210 ms, e: 280 ms, f: 360 ms, g: 550 ms, h: 660 ms, i: 780 ms. Scale bar of dermoscope images: 500 μm)
    Fig. 4. OCT images of injure in mice skin at different duration of 1064 nm laser irradiation (a: 60 ms, b: 100 ms, c: 150 ms, d: 210 ms, e: 280 ms, f: 360 ms, g: 550 ms, h: 660 ms, i: 780 ms. Scale bar of dermoscope images: 500 μm)
    Relationship between laser duration and damage depth
    Fig. 5. Relationship between laser duration and damage depth
    Temperature-time fitting curve
    Fig. 6. Temperature-time fitting curve
    laser duration/msdamageappearance
    0~100first-degree injureWhite coagulation spots appear on the skin epidermis, and the epidermis is flat
    150~210second-degree injureBlisters appear on the skin epidermis, with raised white coagulation spots
    280~550third-degree injureThe epidermis of the skin is slightly vaporized, the dermis is degenerated, and shallow pit-like light red blood spots
    660~$ \infty $fourth-degree injureThe skin epidermis and superficial dermis are vaporized, accompanied by exudation of tissue fluid, eschars appear on the edges of the wound, and deep pit-like crimson blood spots
    Table 1. Classification of 1064 nm laser induced thermal injure in biological skin tissue
    laser duration/mΩ
    603.51×10⁻¹⁰
    1003.86×10−19
    1504.39
    210208.73
    28019607.46
    3604.62×1013
    5506.52×1014
    6602.12×1015
    7805.59×1023
    Table 2. Relationship between laser duration and degree of thermal injure
    Xun Zhou, Qiong Ma, Zhibo Liu, Hongxiang Kang. 1064 nm laser induced thermal injure in mice skin with different laser duration[J]. High Power Laser and Particle Beams, 2022, 34(1): 011012
    Download Citation