• High Power Laser and Particle Beams
  • Vol. 33, Issue 6, 065014 (2021)
Jin Zhang1、2, Zhao Yuan1、2, Lixue Chen1、2, and Shan Liu1、2
Author Affiliations
  • 1State Key Laboratory of Advanced Electromagnetic Engineering and New Technology, Huazhong University of Science and Technology, Wuhan 430074, China
  • 2Key Laboratory of Pulsed Power Technology (Huazhong University of Science and Technology), Ministry of Education, Wuhan 430074, China
  • show less
    DOI: 10.11884/HPLPB202133.210116 Cite this Article
    Jin Zhang, Zhao Yuan, Lixue Chen, Shan Liu. Vacuum arc plasma emission spectroscopy diagnosis[J]. High Power Laser and Particle Beams, 2021, 33(6): 065014 Copy Citation Text show less
    Schematic of the experimental setup
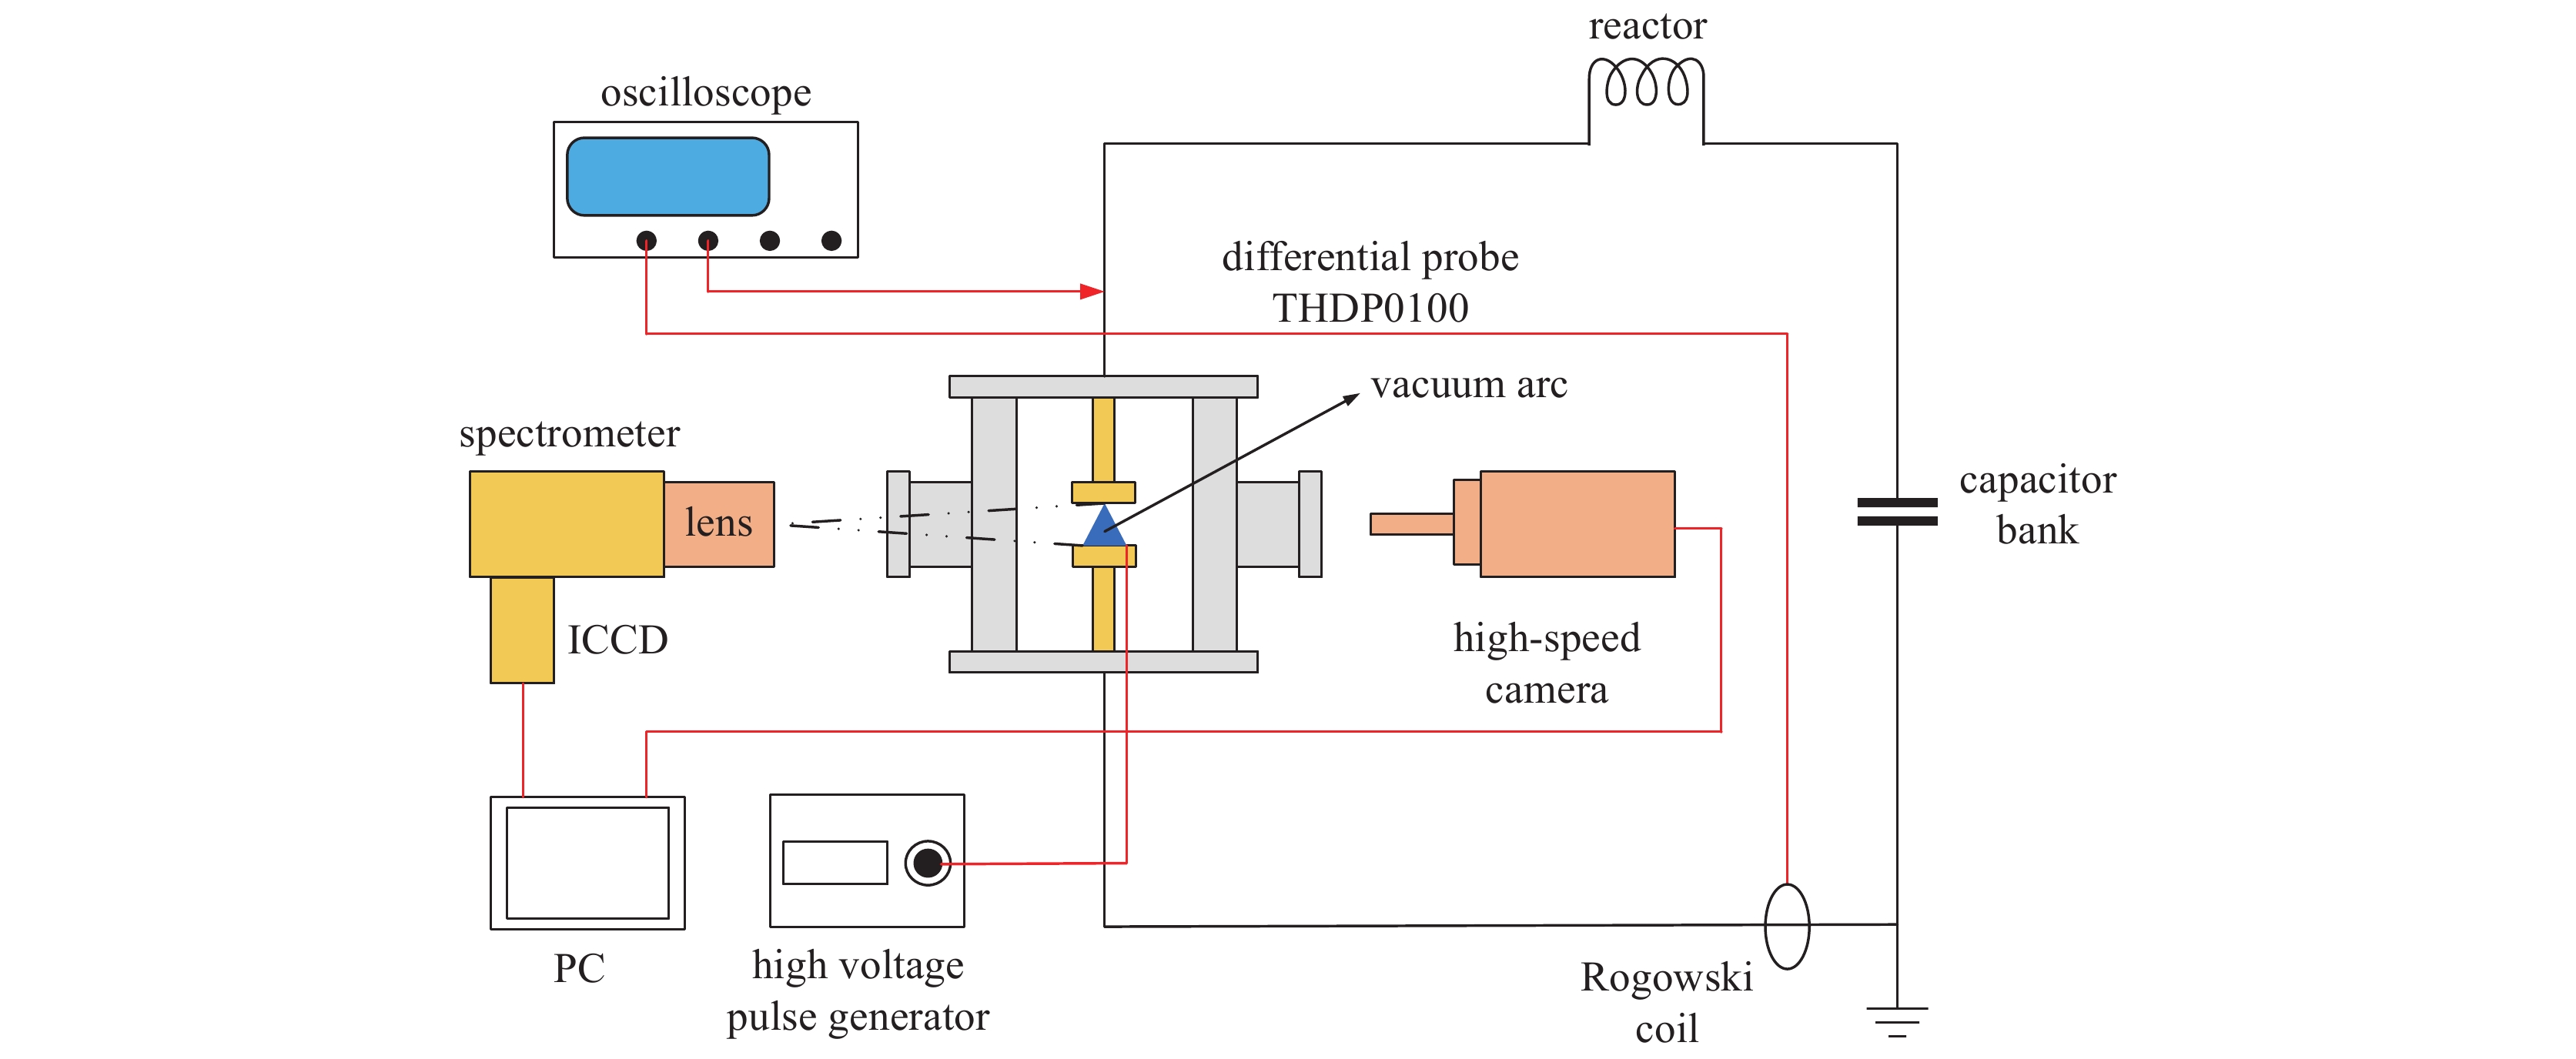
    Fig. 1. Schematic of the experimental setup
    Experimental contact structure
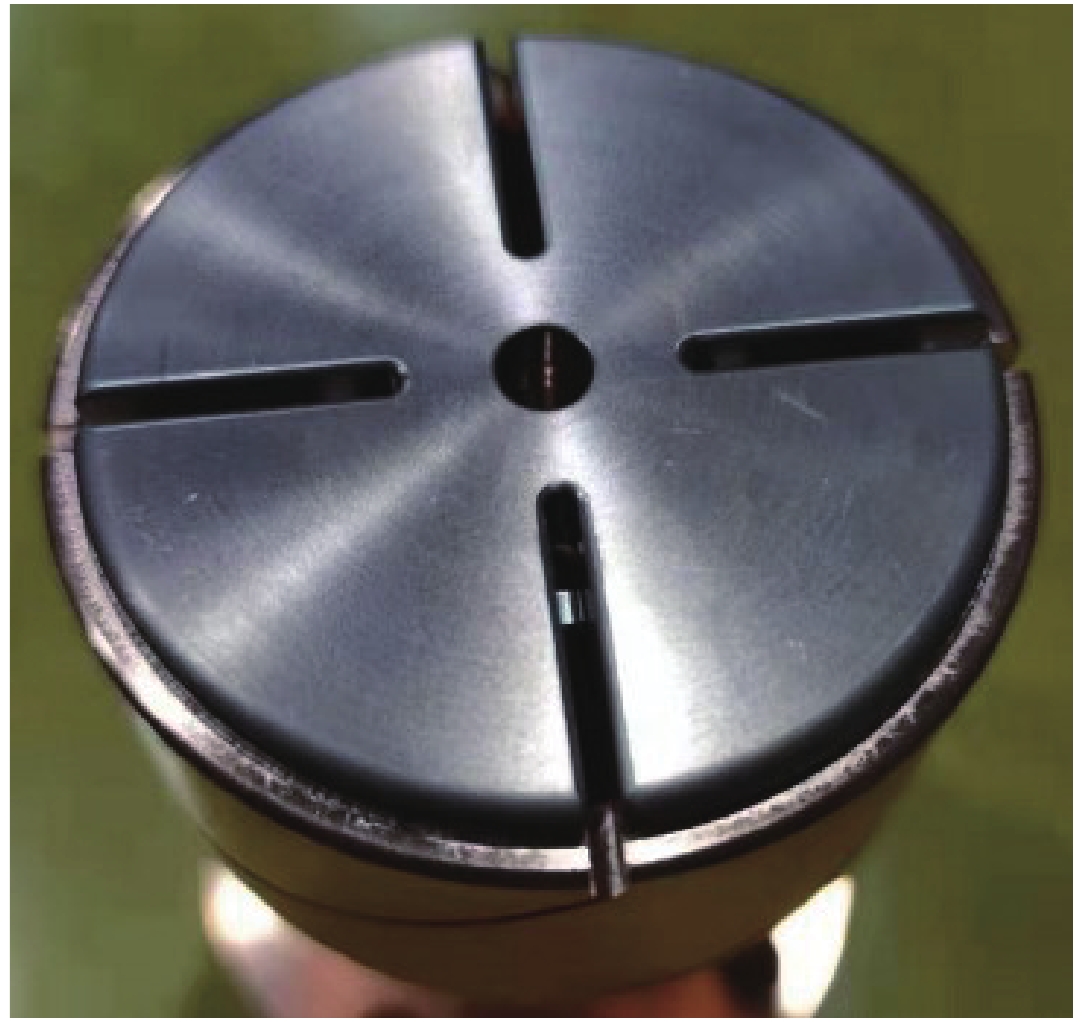
    Fig. 2. Experimental contact structure
    Axial distributions of spectral line intensity
    Fig. 3. Axial distributions of spectral line intensity
    Radial distributions of spectral line intensity
    Fig. 4. Radial distributions of spectral line intensity
    Vacuum arc image and arc column diameter image
    Fig. 5. Vacuum arc image and arc column diameter image
    Axial distribution of electron temperature and electron density
    Fig. 6. Axial distribution of electron temperature and electron density
    wavelength/nm${E_k }$/cm−1${g_k }$${A_{ki} }$/(108s−1
    510.630783.69740.020
    515.449935.19540.600
    521.949942.05160.750
    529.462403.33280.109
    Table 1. [in Chinese]
    Jin Zhang, Zhao Yuan, Lixue Chen, Shan Liu. Vacuum arc plasma emission spectroscopy diagnosis[J]. High Power Laser and Particle Beams, 2021, 33(6): 065014
    Download Citation