
Hao-zhe YU, Li-juan LI, Jiu-yi LI. Establishment of comprehensive drought monitoring model based on downscaling TRMM and MODIS data[J]. Journal of Natural Resources, 2020, 35(10): 2553
- Journal of Natural Resources
- Vol. 35, Issue 10, 2553 (2020)
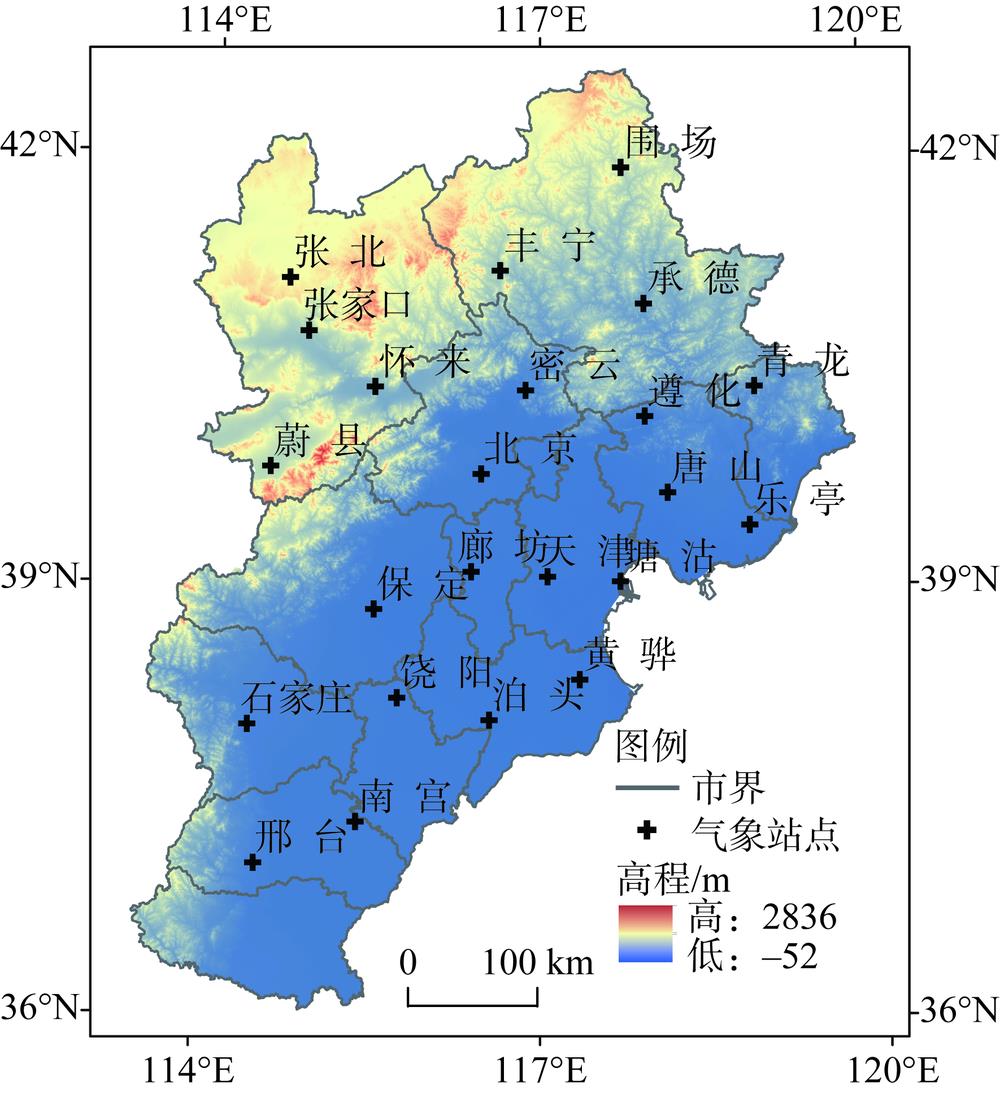
Fig. 1. Geographical location, elevation and distribution of meteorological stations in the Beijing-Tianjin-Hebei region
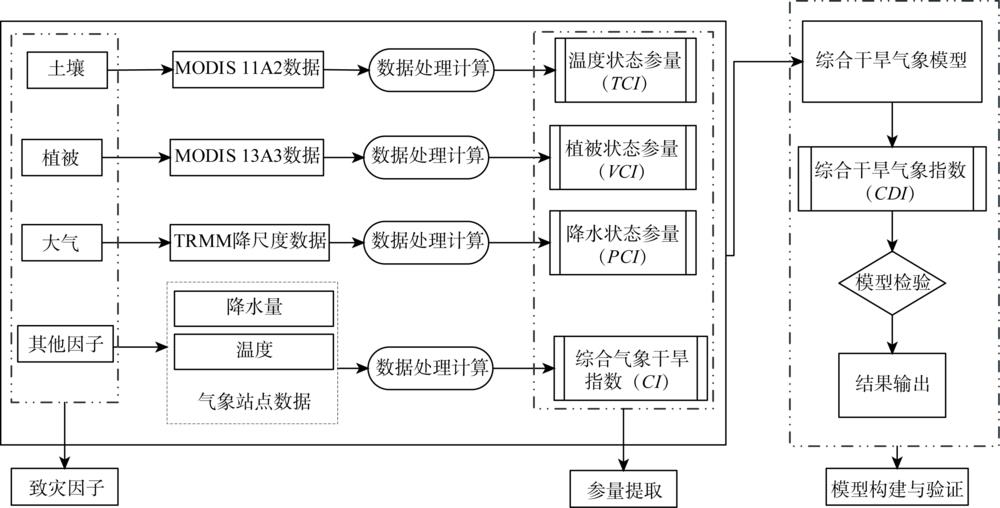
Fig. 2. Flow charts of comprehensive drought monitoring model
Fig. 3. R 2 and Bias variations after downscaling of TRMM annual scale
Fig. 4. Observed precipitation vs. downscaling TRMM precipitation (monthly scale)
Fig. 5. R 2 and Bias variations after downscaling of TRMM monthly scale
Fig. 6. Monthly precipitation in the Beijing-Tianjin-Hebei region during 2007-2016
Fig. 7. Scatter plots and correlation coefficient of R values between SPI -3 and CDI index in each month from 2007 to 2016
Fig. 8. Scatter plots and correlation coefficient of R values between drought-affected crop area and CDI , VCI , TCI from 2007 to 2016
Fig. 9. Scatter plots and correlation coefficient of R values between accumulative CDI and standardized unit yield of crop in the growing period (March-October) from 2007 to 2016
Fig. 10. Scatter plots and goodness-of-fit between CDI and CI in growing period of main crops (March-October) from 2007 to 2016
Fig. 11. Drought map of Beijing-Tianjin-Hebei region in 2016 based on monitored CDI index
Fig. 12. Histogram plot of CDI of the Jing-Jin-Ji region in crop (winter wheat and maize) growing period (March-October) from 2007 to 2016
|
Table 1. Monthly scale regression equation from March to October in 2007-2016
|
Table 2. Classification of drought grades
|
Table 3. Statistics of CDI index changes in the four seasons of 2007-2016

Set citation alerts for the article
Please enter your email address
© Copyright 2018-2021 | Chinese Laser Press. All Rights Reserved 沪ICP备15018463号-20