
Yu-Pei Xu, Shu Li. Modification of method of sampling radiation source particle in spherical geometry [J]. Acta Physica Sinica, 2020, 69(11): 119501-1
- Acta Physica Sinica
- Vol. 69, Issue 11, 119501-1 (2020)
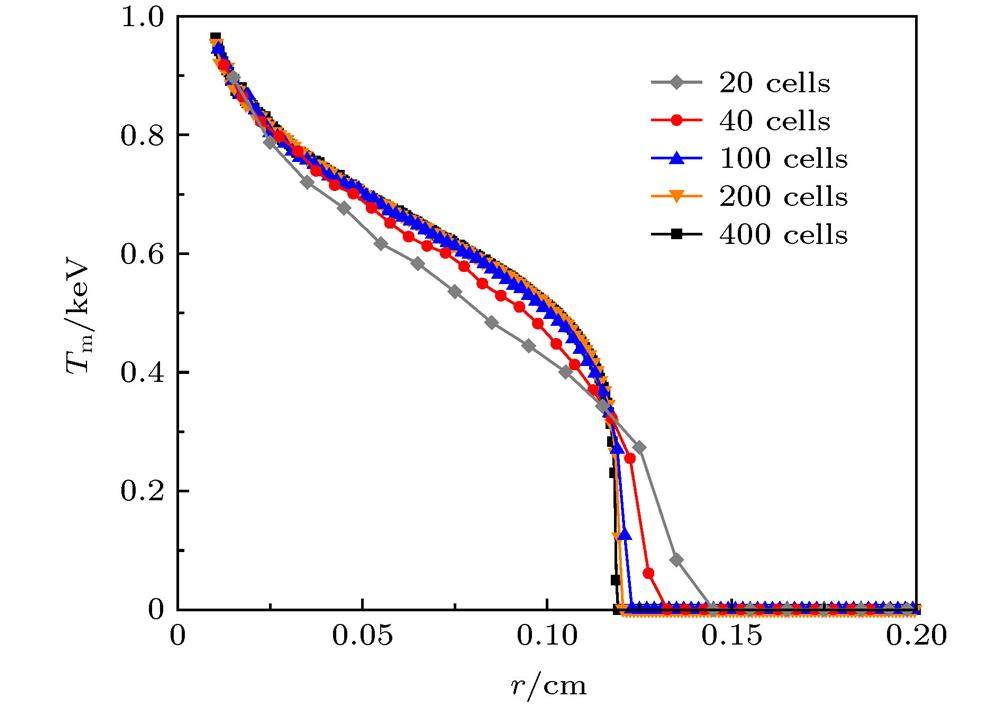
Fig. 1. Material temperature with different cell numbers (t = 10 ns).
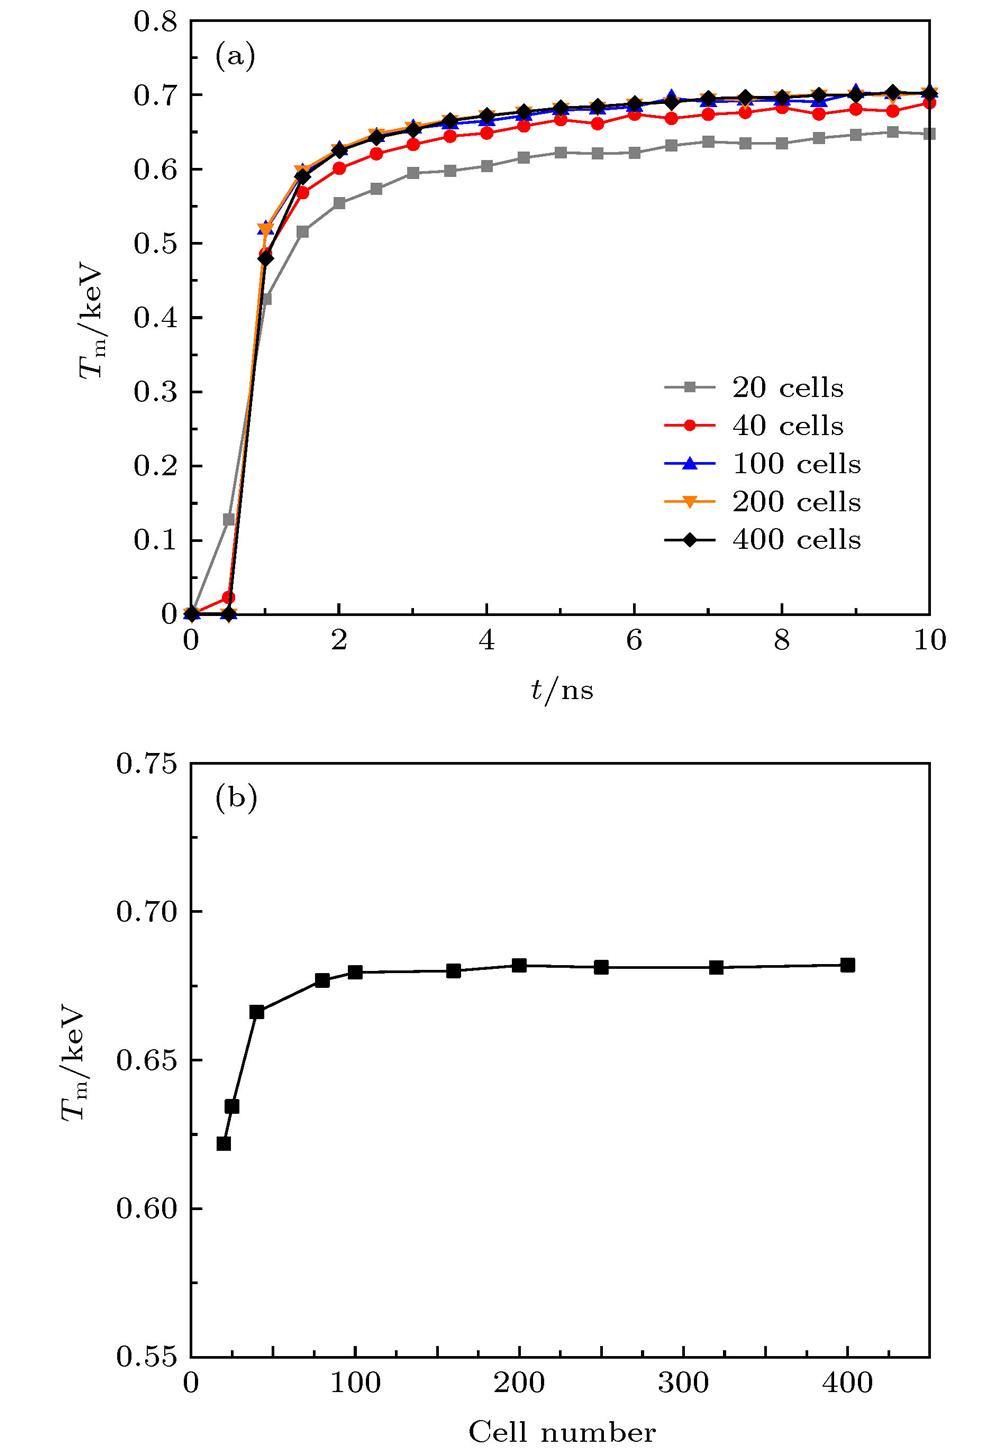
Fig. 2. The convergence of material temperature: (a) Material temperature change with time in r = 0.05 cm; (b) material temperature change with cell number in r = 0.05 cm (t = 5 ns).
Fig. 3. The dependence of temperature on space is approxi-mately linear.
Fig. 4. Spatial probability density distribution of radiation source particle in different positions of radiation wave: (a) Cell 9, in the behind of wave; (b) cell 18, in the behind of wave; (c) cell 22, in the head of wave; (d) cell 26, in the head of wave.
Fig. 5. Material temperature with different cell numbers (t = 10 ns): (a) Multiplying sampling method; (b) stepped approximation sampling method.
Fig. 6. Results of two new sampling methods with 40 cells (t = 10 ns).
|
Table 1. Relative to the reference solution, the standard deviation and the maximum error of temperature curves with different cell numbers.
|
Table 2. Computation time with different cell numbers.
| |||||||||||||||||||||||||||||||
Table 3. Relative to the reference solution, the standard deviation, and the maximum error of temperature curves with difference cell numbers.
|
Table 4. Computation time of the problem.

Set citation alerts for the article
Please enter your email address
© Copyright 2018-2021 | Chinese Laser Press. All Rights Reserved 沪ICP备15018463号-20