• Acta Physica Sinica
  • Vol. 69, Issue 3, 038701-1 (2020)
Dong-Fei Ma1、3, Wen-Qing Hou1、3, Chun-Hua Xu1, Chun-Yu Zhao2、3, Jian-Bing Ma1, Xing-Yuan Huang1、3, Qi Jia1、3, Lu Ma1、*, Cong Liu2、3, Ming Li1、3, and Ying Lu1、3、*
Author Affiliations
  • 1Beijing National Laboratory for Condensed Matter Physics and CAS Key Laboratory of Soft Matter Physics, Institute of Physics, Chinese Academy of Sciences, Beijing 100190, China
  • 2Interdisciplinary Research Center on Biology and Chemistry, Shanghai Institute of Organic Chemistry, Chinese Academy of Sciences, Shanghai 200032, China
  • 3University of Chinese Academy of Sciences, Beijing 100049, China
  • show less
    DOI: 10.7498/aps.69.20191607 Cite this Article
    Dong-Fei Ma, Wen-Qing Hou, Chun-Hua Xu, Chun-Yu Zhao, Jian-Bing Ma, Xing-Yuan Huang, Qi Jia, Lu Ma, Cong Liu, Ming Li, Ying Lu. Investigation of structure and dynamics of α-synuclein on membrane by quenchers-in-a-liposome fluorescence resonance energy transfer method[J]. Acta Physica Sinica, 2020, 69(3): 038701-1 Copy Citation Text show less
    The LipoFRET method: (a) The schematic picture of LipoFRET experiment; (b) the relationship between distance from the inner surface of the liposome lipid bilayer and relative intensity F/F0. The quencher used here is trypan blue and the fluorophore is Alexa Fluor 555 (Alexa 555). The curves correspond to liposomes encapsulating 2.5 mM (above) and 5 mM (bottom) trypan blue.LipoFRET方法 (a) LipoFRET的实验体系示意图; (b) LipoFRET的距离-相对亮度曲线, 其中淬灭剂为台盼蓝, 所用的荧光分子为Alexa Fluor 555 (Alexa 555), 距离是指荧光基团到脂质体磷脂双层膜的内表面的距离, 曲线分别对应包封2.5 mM (上方曲线)及5 mM (下方曲线)台盼蓝的脂质体.
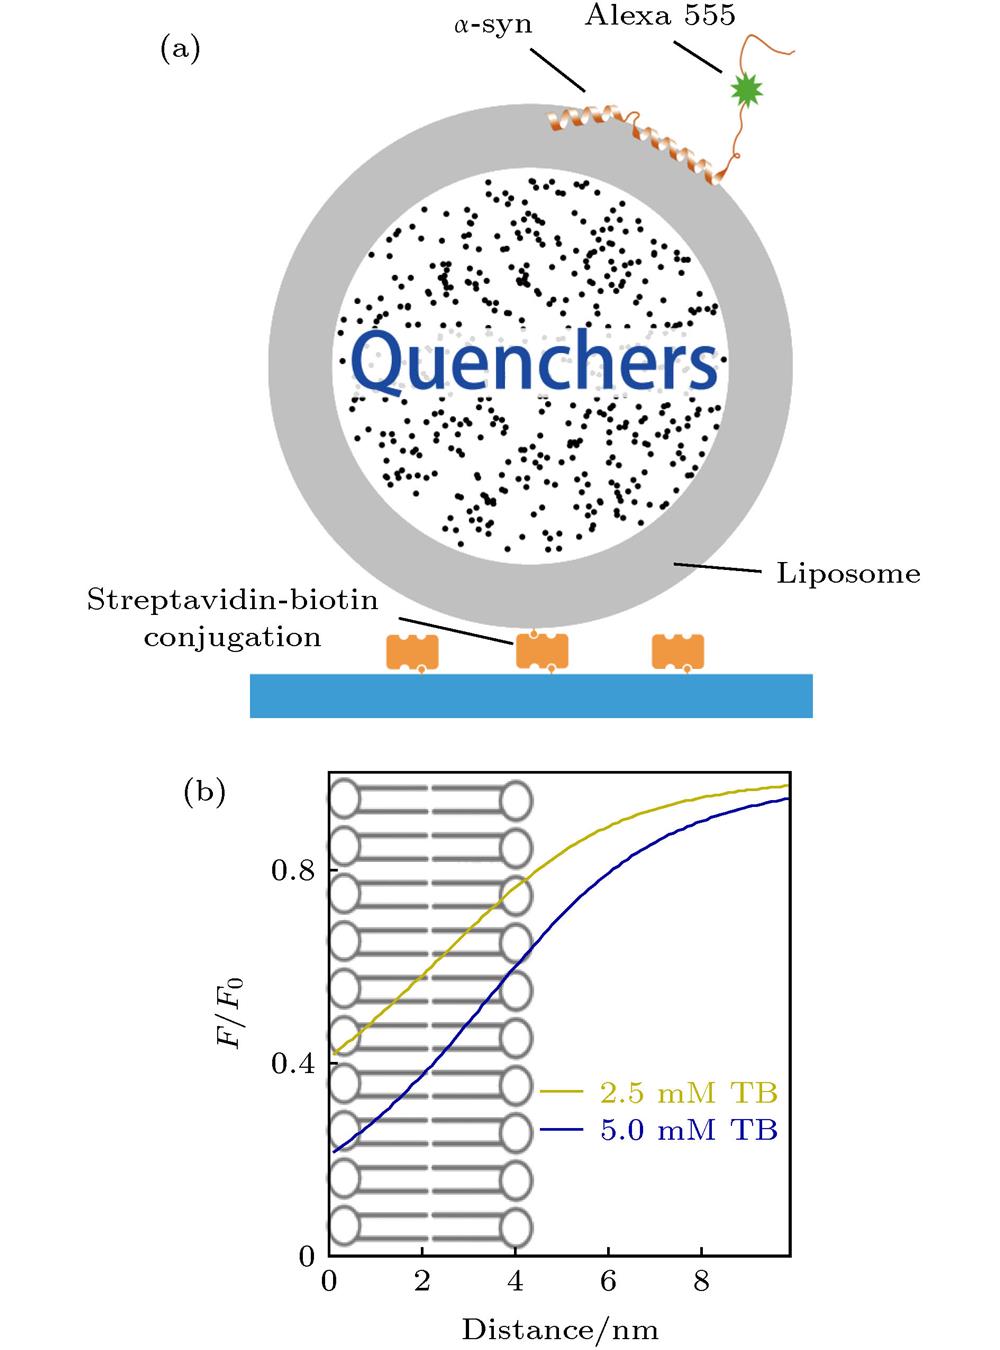
    Fig. 1. The LipoFRET method: (a) The schematic picture of LipoFRET experiment; (b) the relationship between distance from the inner surface of the liposome lipid bilayer and relative intensity F/F0. The quencher used here is trypan blue and the fluorophore is Alexa Fluor 555 (Alexa 555). The curves correspond to liposomes encapsulating 2.5 mM (above) and 5 mM (bottom) trypan blue. LipoFRET方法 (a) LipoFRET的实验体系示意图; (b) LipoFRET的距离-相对亮度曲线, 其中淬灭剂为台盼蓝, 所用的荧光分子为Alexa Fluor 555 (Alexa 555), 距离是指荧光基团到脂质体磷脂双层膜的内表面的距离, 曲线分别对应包封2.5 mM (上方曲线)及5 mM (下方曲线)台盼蓝的脂质体.
    Dynamic of α-syn T72C-Alexa 555 on liposome encapsulating 5 mM trypan blue in the presence of low and high protein concentration in solution: (a) Typical intensity traces of α-syn T72C-Alexa 555 under 0.1 nM (upper panel) or 50 nM wt-α-syn (lower panel) in solution (the grey and green line correspond to the intensity traces on liposomes entrapping buffer (F0) and on liposomes entrapping trypan blue (F), respectively); (b) the intensity histograms of the states under 0.1 nM (upper panel) or 50 nM wt-α-syn (lower panel) in solution (the error bars on the histograms represent the statistical error in the bins); (c) the scheme of the position change of α-syn T72 on the membrane with increased protein concentration in the solution; (d) more intensity traces of α-syn T72C-Alexa 555 in the presence of 50 nM wt-α-syn in solution.溶液中存在低蛋白浓度或高蛋白浓度时, α-syn T72C-Alexa 555在包封5 mM台盼蓝的脂质体上的动态特征 (a)蛋白总浓度为0.1 nM (上图)与50 nM (下图)时的典型亮度曲线(其中灰色曲线与绿色曲线分别为包封缓冲液脂质体与包封台盼蓝脂质体上的相对亮度曲线(F/F0)); (b)蛋白总浓度为0.1 nM (上图)与50 nM (下图)时的亮度统计(误差线代表统计偏差); (c)低浓度(上部)与高浓度(下部)时, 在磷脂膜上的位置特征示意图; (d)蛋白总浓度为50 nM时更多的典型亮度曲线
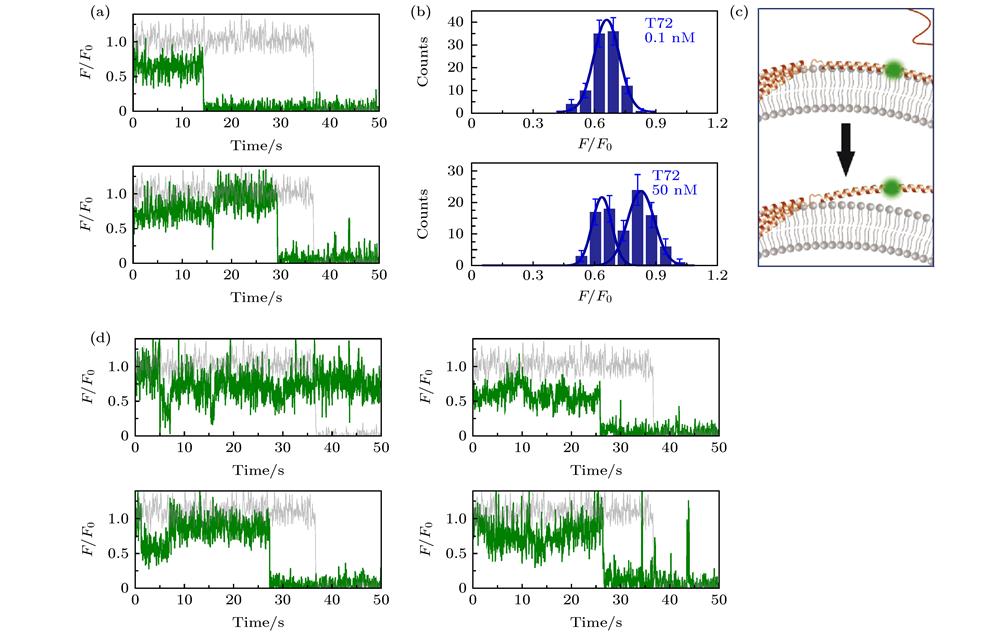
    Fig. 2. Dynamic of α-syn T72C-Alexa 555 on liposome encapsulating 5 mM trypan blue in the presence of low and high protein concentration in solution: (a) Typical intensity traces of α-syn T72C-Alexa 555 under 0.1 nM (upper panel) or 50 nM wt-α-syn (lower panel) in solution (the grey and green line correspond to the intensity traces on liposomes entrapping buffer (F0) and on liposomes entrapping trypan blue (F), respectively); (b) the intensity histograms of the states under 0.1 nM (upper panel) or 50 nM wt-α-syn (lower panel) in solution (the error bars on the histograms represent the statistical error in the bins); (c) the scheme of the position change of α-syn T72 on the membrane with increased protein concentration in the solution; (d) more intensity traces of α-syn T72C-Alexa 555 in the presence of 50 nM wt-α-syn in solution. 溶液中存在低蛋白浓度或高蛋白浓度时, α-syn T72C-Alexa 555在包封5 mM台盼蓝的脂质体上的动态特征 (a)蛋白总浓度为0.1 nM (上图)与50 nM (下图)时的典型亮度曲线(其中灰色曲线与绿色曲线分别为包封缓冲液脂质体与包封台盼蓝脂质体上的相对亮度曲线(F/F0)); (b)蛋白总浓度为0.1 nM (上图)与50 nM (下图)时的亮度统计(误差线代表统计偏差); (c)低浓度(上部)与高浓度(下部)时, 在磷脂膜上的位置特征示意图; (d)蛋白总浓度为50 nM时更多的典型亮度曲线
    Dynamic of α-syn K10C-Alexa 555 on liposome encapsulating 2.5 mM trypan blue in the presence of low and high protein concentration in solution: (a) Typical intensity traces of α-syn K10 C-Alexa 555 under 0.1 nM (upper panel) or 50 nM wt-α-syn (lower panel) in solution (the grey and dark blue line correspond to the intensity traces on liposomes entrapping buffer (F0) and on liposomes entrapping trypan blue (F), respectively); (b) the intensity histograms of the states under 0.1 nM (upper panel) or 50 nM wt-α-syn (lower panel) in solution (the error bars on the histograms represent the statistical error in the bins); (c) the scheme of the position change of α-syn K10 on the membrane with increased protein concentration in the solution; (d) more intensity traces in the presence of 50 nM wt-α-syn in solution.包封2.5 mM台盼蓝的脂质体上的α-syn K10C-Alexa 555在溶液中存在低浓度与高浓度wt-50 nM wt-α-syn时的动态特征(a)蛋白总浓度为0.1 nM (上图)与50 nM (下图)时的典型亮度曲线(其中灰色曲线与深蓝色曲线分别为包封缓冲液脂质体与包封台盼蓝脂质体上的相对亮度曲线(F/F0)); (b)蛋白总浓度为0.1 nM (上图)与50 nM (下图)时的亮度统计(误差线代表统计偏差); (c)蛋白低浓度(上部)与高浓度(下部)时, 在磷脂膜上的位置特征示意图; (d)蛋白总浓度为50 nM时更多的典型亮度曲线
    Fig. 3. Dynamic of α-syn K10C-Alexa 555 on liposome encapsulating 2.5 mM trypan blue in the presence of low and high protein concentration in solution: (a) Typical intensity traces of α-syn K10 C-Alexa 555 under 0.1 nM (upper panel) or 50 nM wt-α-syn (lower panel) in solution (the grey and dark blue line correspond to the intensity traces on liposomes entrapping buffer (F0) and on liposomes entrapping trypan blue (F), respectively); (b) the intensity histograms of the states under 0.1 nM (upper panel) or 50 nM wt-α-syn (lower panel) in solution (the error bars on the histograms represent the statistical error in the bins); (c) the scheme of the position change of α-syn K10 on the membrane with increased protein concentration in the solution; (d) more intensity traces in the presence of 50 nM wt-α-syn in solution. 包封2.5 mM台盼蓝的脂质体上的α-syn K10C-Alexa 555在溶液中存在低浓度与高浓度wt-50 nM wt-α-syn时的动态特征(a)蛋白总浓度为0.1 nM (上图)与50 nM (下图)时的典型亮度曲线(其中灰色曲线与深蓝色曲线分别为包封缓冲液脂质体与包封台盼蓝脂质体上的相对亮度曲线(F/F0)); (b)蛋白总浓度为0.1 nM (上图)与50 nM (下图)时的亮度统计(误差线代表统计偏差); (c)蛋白低浓度(上部)与高浓度(下部)时, 在磷脂膜上的位置特征示意图; (d)蛋白总浓度为50 nM时更多的典型亮度曲线
    Fraction of the remaining fluorescence spots of α-syn T72C-Alexa 555 on the liposomes versus time. The solution contains 1 nM, 10 nM, or 100 nM wt-α-syn. The error bars on the histograms represent the statistical error in the bins.溶液中含有1 nM, 10 nM, 100 nM的wt-α-syn时, 视野中脂质体上的α-syn T72C-Alexa 555数量相对于原始数量的比值随时间变化趋势(误差线代表统计偏差)
    Fig. 4. Fraction of the remaining fluorescence spots of α-syn T72C-Alexa 555 on the liposomes versus time. The solution contains 1 nM, 10 nM, or 100 nM wt-α-syn. The error bars on the histograms represent the statistical error in the bins.溶液中含有1 nM, 10 nM, 100 nM的wt-α-syn时, 视野中脂质体上的α-syn T72C-Alexa 555数量相对于原始数量的比值随时间变化趋势(误差线代表统计偏差)
    Model corresponding to the dissociation of α-syn from the membrane which was promoted by increased protein concentration.溶液中高浓度的α-syn促进标记Alexa 555的α-syn从膜上解离的过程模型
    Fig. 5. Model corresponding to the dissociation of α-syn from the membrane which was promoted by increased protein concentration.溶液中高浓度的α-syn促进标记Alexa 555的α-syn从膜上解离的过程模型
    名称氨基酸序列(1—140)
    Human α-synuclein MDVFMKGLSKAKEGVVAAAEKTKQGVAEAAGKTKEGVL YVGSKTKEGVVHGVATVAEKTKEQVTNVGGAVVTGVTAV AQKTVEGAGSIAAATGFVKKDQLGKNEEGAPQEGILEDM PVDPDNEAYEMPSEEGYQDYEPEA
    Table 1.

    Sequences of α-syn.

    α-syn的氨基酸序列

    Dong-Fei Ma, Wen-Qing Hou, Chun-Hua Xu, Chun-Yu Zhao, Jian-Bing Ma, Xing-Yuan Huang, Qi Jia, Lu Ma, Cong Liu, Ming Li, Ying Lu. Investigation of structure and dynamics of α-synuclein on membrane by quenchers-in-a-liposome fluorescence resonance energy transfer method[J]. Acta Physica Sinica, 2020, 69(3): 038701-1
    Download Citation