• Resources Science
  • Vol. 42, Issue 10, 2022 (2020)
Yangyang MENG1、2, Zhibin HE1、*, Bing LIU1, Longfei CHEN1, and Bei LIU3
Author Affiliations
  • 1Linze Inland River Basin Research Station, Chinese Ecosystem Research Network, Northwest Institute of Eco-Environment and Resources, CAS, Lanzhou 730000, China
  • 2University of Chinese Academy of Sciences, Beijing 100049, China
  • 3Xi’an Mineral Resources Research Center of China Geological Survey, Xi’an 710100, China
  • show less
    DOI: 10.18402/resci.2020.10.18 Cite this Article
    Yangyang MENG, Zhibin HE, Bing LIU, Longfei CHEN, Bei LIU. Changes of spatial distribution and ecosystem service value of oasis wetlands in arid areas: Taking three typical inland river basins as examples[J]. Resources Science, 2020, 42(10): 2022 Copy Citation Text show less
    Location of the three typical oasis wetlands
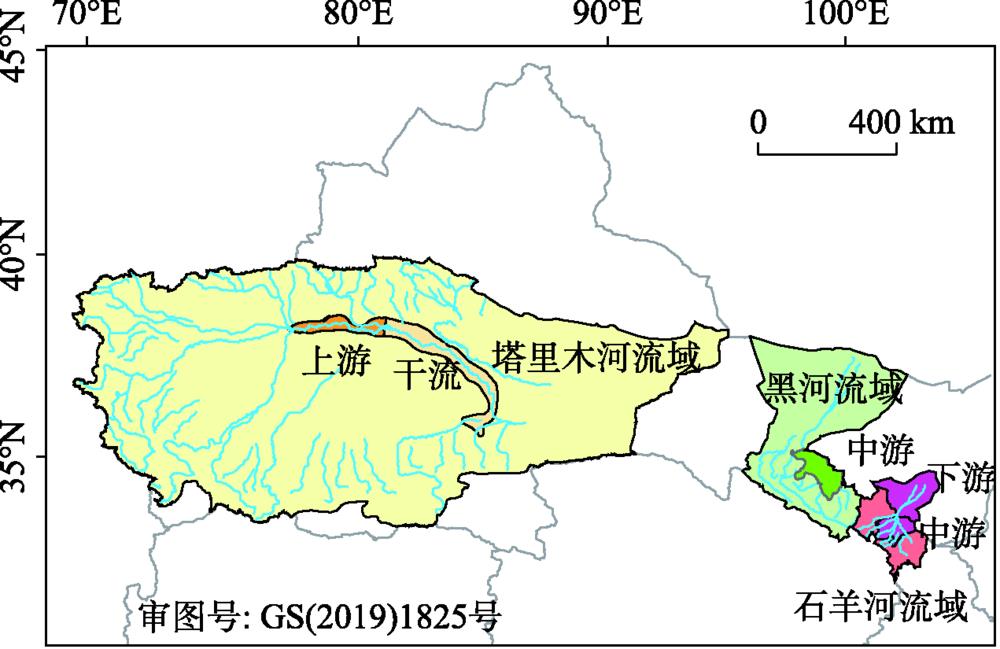
    Fig. 1. Location of the three typical oasis wetlands
    Changes of annual total precipitation and annual average temperature in typical oases, 1975-2015
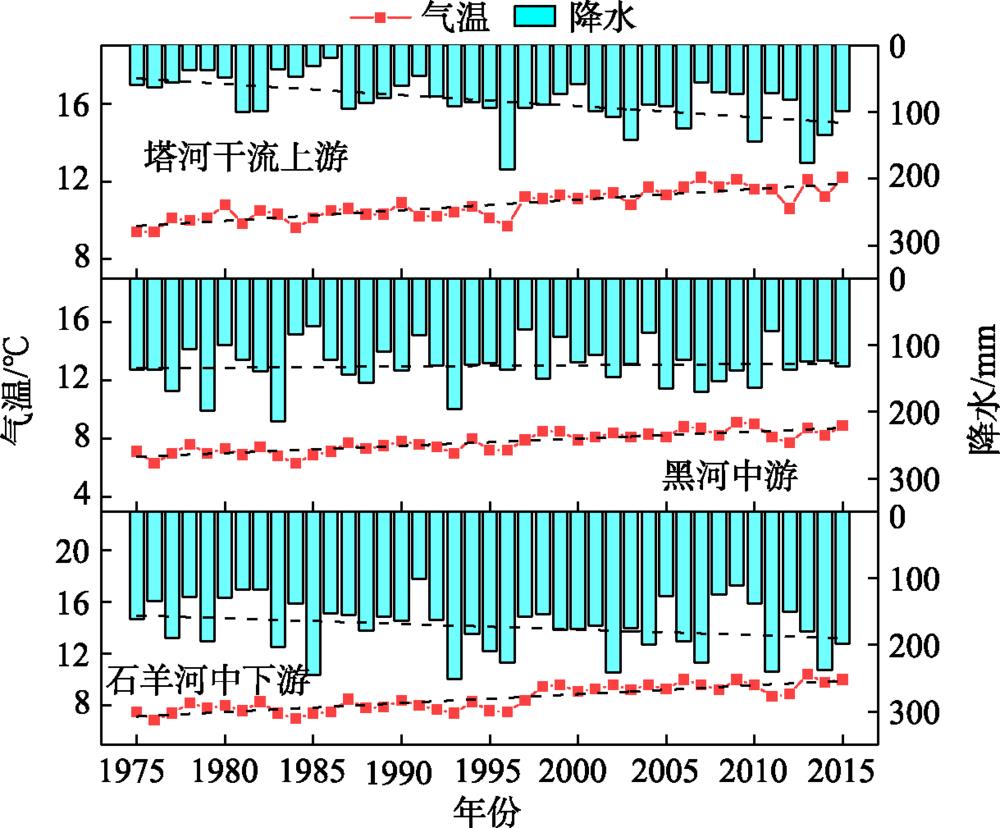
    Fig. 2. Changes of annual total precipitation and annual average temperature in typical oases, 1975-2015
    Landscape index changes of oasis wetlands (a. Number of patches (NP); b. Patch density (PD); c. Maximum patch index (LPI); d. Aggregation index (AI)), 1975-2015
    Fig. 3. Landscape index changes of oasis wetlands (a. Number of patches (NP); b. Patch density (PD); c. Maximum patch index (LPI); d. Aggregation index (AI)), 1975-2015
    Land use/cover changes in the three typical oases, 1975-2015
    Fig. 4. Land use/cover changes in the three typical oases, 1975-2015
    Changes of ecosystem service value of oasis wetlands (a. Upstream of the main stream of the Tarim River; b. Middle reaches of the Heihe River; c. Middle and lower reaches of the Shiyang River), 1975-2015
    Fig. 5. Changes of ecosystem service value of oasis wetlands (a. Upstream of the main stream of the Tarim River; b. Middle reaches of the Heihe River; c. Middle and lower reaches of the Shiyang River), 1975-2015
    Land use/cover change and changes of its contribution rates to ecosystem service value (ESV) in oases (a, b. Upstream of the main stream of the Tarim River; c, d. Middle reaches of the Heihe River; e, f. Middle and lower reaches of the Shiyang River), 1975-2015
    Fig. 6. Land use/cover change and changes of its contribution rates to ecosystem service value (ESV) in oases (a, b. Upstream of the main stream of the Tarim River; c, d. Middle reaches of the Heihe River; e, f. Middle and lower reaches of the Shiyang River), 1975-2015
    年份塔河干流上游黑河中游石羊河中下游
    绿洲湿地面积/hm2占绿洲面积比例/%绿洲湿地面积/hm2占绿洲面积比例/%绿洲湿地面积/hm2占绿洲面积比例/%
    197560762.426.5611481.931.0912960.810.63
    199061717.326.6710229.760.9714270.310.70
    199565627.287.085501.430.525476.410.27
    200043252.834.674803.840.454214.700.21
    200545927.634.967243.920.693224.970.16
    201559182.026.397345.710.692489.850.12
    Table 1. Areas and proportions of the three typical oasis wetlands, 1975-2015
    一级服务类型二级服务类型塔河干流上游ESV/(元/hm2黑河中游ESV/(元/hm2石羊河中下游ESV/(元/hm2
    供给服务食物生产776.21895.01488.33
    原料生产317.42347.18153.62
    水资源供给1842.983190.431621.07
    调节服务气体调节1122.981219.78522.77
    气候调节2792.773106.181477.96
    净化环境5401.496224.843390.08
    支持服务水文调节22211.7138618.8819898.22
    土壤保持873.941362.77791.69
    维持养分循环104.03112.7447.80
    生物多样性4139.804440.761790.32
    文化服务美学景观2774.103010.881285.65
    合计42357.4162529.4531467.51
    Table 2. Ecosystem service value of the three typical oasis wetlands per unit area
    Yangyang MENG, Zhibin HE, Bing LIU, Longfei CHEN, Bei LIU. Changes of spatial distribution and ecosystem service value of oasis wetlands in arid areas: Taking three typical inland river basins as examples[J]. Resources Science, 2020, 42(10): 2022
    Download Citation