• Resources Science
  • Vol. 42, Issue 4, 723 (2020)
Qingke YANG1, Xuejun DUAN2、*, Zhifeng JIN3、4, Lei WANG2, and Yazhu WANG2
Author Affiliations
  • 1School of Public Administration, Nanjing University of Finance & Economics, Nanjing 210023, China
  • 2Nanjing Institute of Geography and Limnology, CAS, Nanjing 210008, China
  • 3School of Resource and Environmental Science, Wuhan University, Wuhan 430079, China
  • 4Jiangsu Institute of Land Surveying and Planning, Nanjing 210017, China
  • show less
    DOI: 10.18402/resci.2020.04.11 Cite this Article
    Qingke YANG, Xuejun DUAN, Zhifeng JIN, Lei WANG, Yazhu WANG. Spatiotemporal differentiation and influencing mechanism of urban land development intensity in the Yangtze River Delta[J]. Resources Science, 2020, 42(4): 723 Copy Citation Text show less
    A theoretical framework of urban land development intensity
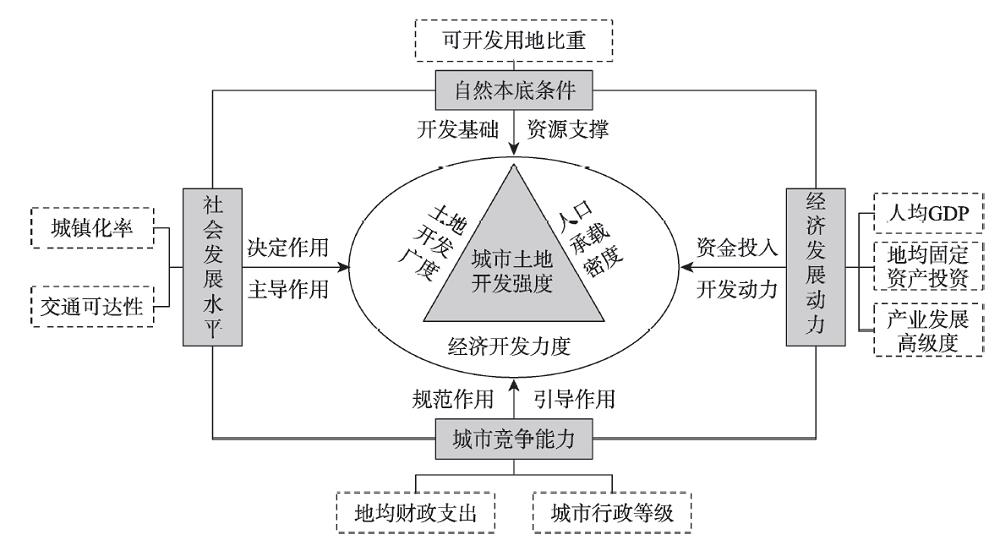
    Fig. 1. A theoretical framework of urban land development intensity
    Spatial distribution of urban land development intensity
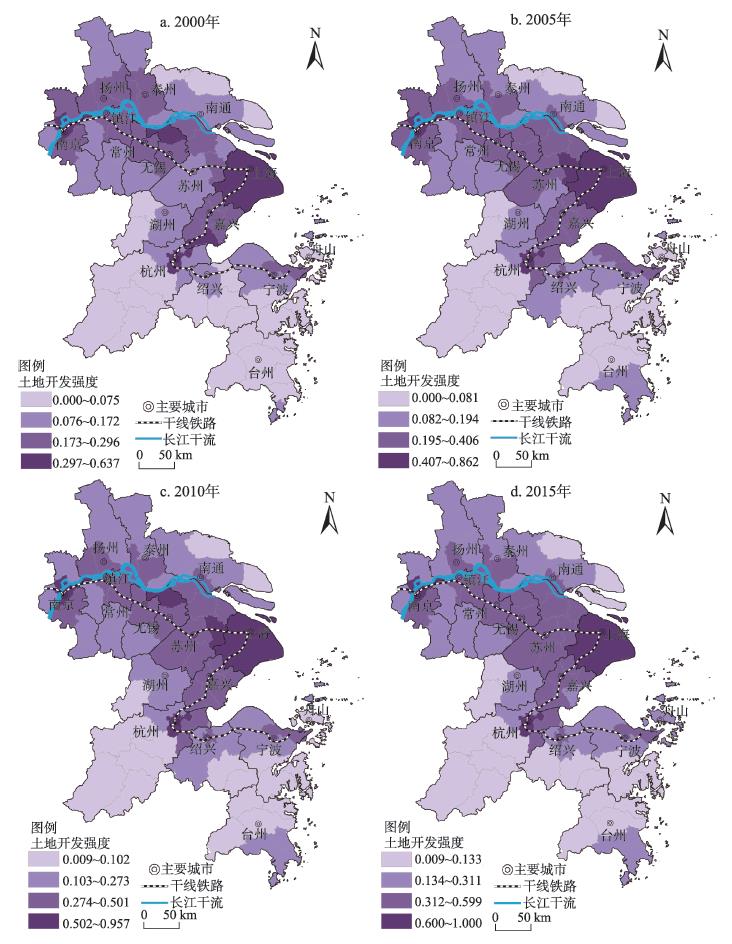
    Fig. 2. Spatial distribution of urban land development intensity
    Local indicators of spatial association (LISA) of urban land development intensity
    Fig. 3. Local indicators of spatial association (LISA) of urban land development intensity
    类型指标选取测算方法作用方向
    自然本底条件可开发用地比重(Dland)/%运用空间减法来计算:可开发用地比重= 1 - 不可建设土地面积(包括不可建设的湖泊河流水面、不可建设的陡岩石区等)比重-基本农田保护面积比重-已开发用地比重+/-
    社会发展水平城镇化率(DUrban)/%城镇人口/常住总人口+
    交通可达性(Traffic)/km依靠主要交通干线,各评价单元到中心城市(上海、南京、杭州、苏州、宁波)的时间和空间距离,具体测算方法参照文献[34]。+
    经济发展动力人均GDP(PGDP)/(万元/人)人均地区生产总值+
    地均固定资产投资(FInvest)/(万元/km2)固定资产投资总额/城市土地面积+
    产业发展高级度(Indust高级度指数(IH)= 用于度量第二、三产业相对第一产业转移的效应(θ1)+ 第二产业向第三产业转移的效应(θ2[25]-
    城市竞争能力地均财政支出(Finance)/(万元/km2)一般公共预算支出/城市土地面积+
    城市行政等级(Admin作为虚拟变量,按照城市行政级别高低,对县(县级市)、地级市、副省级、直辖市城市分别赋值1、2、3、4+
    Table 1. Factors affecting urban land development intensity
    指标2000200520102015
    Moran’s I0.4390.3400.3970.394
    Z(I)36.54931.92634.52534.082
    E(I)0.0030.0020.0020.002
    Table 2. Estimation of Moran’s I of urban land development intensity
    DlandDUrbanTrafficPGDPFInvestIndustFinanceAdmin
    Dland1
    DUrban0.0691
    Traffic0.1640.1541
    PGDP0.1350.5220.1641
    FInvest-0.1060.0190.0260.1611
    Indust0.3470.5210.0330.1790.2871
    Finance-0.4030.147-0.1140.2010.0810.1581
    Admin0.1370.1680.0840.0730.2600.1420.0471
    Table 3. Coefficient matrix of influencing factors
    自变量2000200520102015
    系数Sig.系数Sig.系数Sig.系数Sig.
    常数项-0.0480.166-0.1010.122-0.1550.040-0.1880.010
    Dland0.1540.0000.1040.0240.0960.1060.0790.225
    Durban0.1630.0350.1260.0740.2040.0010.0650.312
    Traffic0.1250.0460.1450.0750.2150.0030.2260.004
    PGDP0.7870.0111.1210.0000.5180.0000.4950.000
    Finvest0.9730.0470.4350.0250.4250.0030.3430.001
    Indust0.0790.4770.1340.3120.2660.0820.2180.059
    Finance-0.1500.7900.0530.883-0.3690.020-0.0040.963
    Admin0.1020.0190.0540.3170.1870.0000.2240.000
    R20.6780.6250.7120.652
    调整R20.6140.5290.6810.608
    F-statistics19.18327.30839.34432.732
    Sig.0.0000.0000.0000.000
    Table 4. Regression results of oridinary least squares (OLS) model
    自变量2000200520102015
    Model 1Model 2Model 3Model 1Model 2Model 3Model 1Model 2Model 3Model 1Model 2Model 3
    常数项-0.207-0.148**-0.219-0.020-0.146-0.316*-0.215-0.229*-0.141**-0.318-0.331*-0.379**
    Dland0.135***0.155**0.138***-0.0150.170***0.130**-0.025*0.316**0.115**0.0710.198**0.086
    Durban0.212***0.171**0.317***0.132*0.361***0.209***0.196**0.072**
    Traffic0.173**0.124**0.355***0.151*0.351***0.218**0.324***0.231**
    PGDP1.007**0.769**1.338**1.127**0.661***0.515*0.563**0.501
    Finvest0.926*0.937*0.429***0.431**0.503**0.441**0.313**0.348
    Indust0.222**0.0920.1860.1400.515**0.302**0.299**0.224**
    Finance0.5100.1640.208*0.0590.028**0.089***0.108*0.012
    Admin0.103*0.1240.1020.115*0.097**0.0580.200**0.163**0.1880.348**0.209***0.228***
    Lambda-0.233-0.181-0.150-0.422**-0.017-0.001-0.239-0.204-0.224-0.142-0.117-0.014
    R20.6080.6060.6530.5350.6930.7230.6620.7180.7880.7670.7220.755
    LOG L106.686106.549112.25270.89690.34794.93575.81884.10797.15890.76978.16584.077
    LR Test0.237-0.013-0.0060.2320.0390.0450.279-0.011-0.0210.0040.0070.040
    AIC-201.602-193.202-207.650-130.939-169.841-173.015-140.781-157.360-177.463-106.684-145.475-151.300
    SC-188.002-187.803-185.990-116.499-155.401-151.355-126.341-142.919-155.802-92.244-131.035-129.640
    Table 5. Regression results of structural equation modeling (SEM)
    Qingke YANG, Xuejun DUAN, Zhifeng JIN, Lei WANG, Yazhu WANG. Spatiotemporal differentiation and influencing mechanism of urban land development intensity in the Yangtze River Delta[J]. Resources Science, 2020, 42(4): 723
    Download Citation