• Journal of Geo-information Science
  • Vol. 22, Issue 9, 1814 (2020)
Yanjie WANG1,2, Juanle WANG2,4,*, Haishuo WEI2,3, Ochir ALTANSUKH5..., Davaasuren DAVAADORJ6 and Chonokhuu SONOMDAGVA5|Show fewer author(s)
Author Affiliations
  • 1College of Geoscience and Surveying Engineering, China University of Mining & Technology, Beijing 100083, China
  • 2State Key Laboratory of Resources and Environmental Information System, Institute of Geographic Sciences and Natural Resources Research, Chinese Academy of Sciences, Beijing 100101, China
  • 3School of Civil and Architectural Engineering, Shandong University of Technology, Zibo 255049, China
  • 4Jiangsu Center for Collaborative Innovation in Geographical Information Resource Development and Application, Nanjing 210023, China
  • 5School of Engineering and Applied Sciences, National University of Mongolia, Ulaanbaatar 210646, Mongolia
  • 6School of the Art & Sciences, National University of Mongolia, Ulaanbaatar 210646, Mongolia
  • show less
    DOI: 10.12082/dqxxkx.2020.190675 Cite this Article
    Yanjie WANG, Juanle WANG, Haishuo WEI, Ochir ALTANSUKH, Davaasuren DAVAADORJ, Chonokhuu SONOMDAGVA. Study on Estimation Method of Mongolia Grassland Production based on Sparse Samples[J]. Journal of Geo-information Science, 2020, 22(9): 1814 Copy Citation Text show less
    200 km buffer zone along the China-Mongolia Railway (Mongolia)
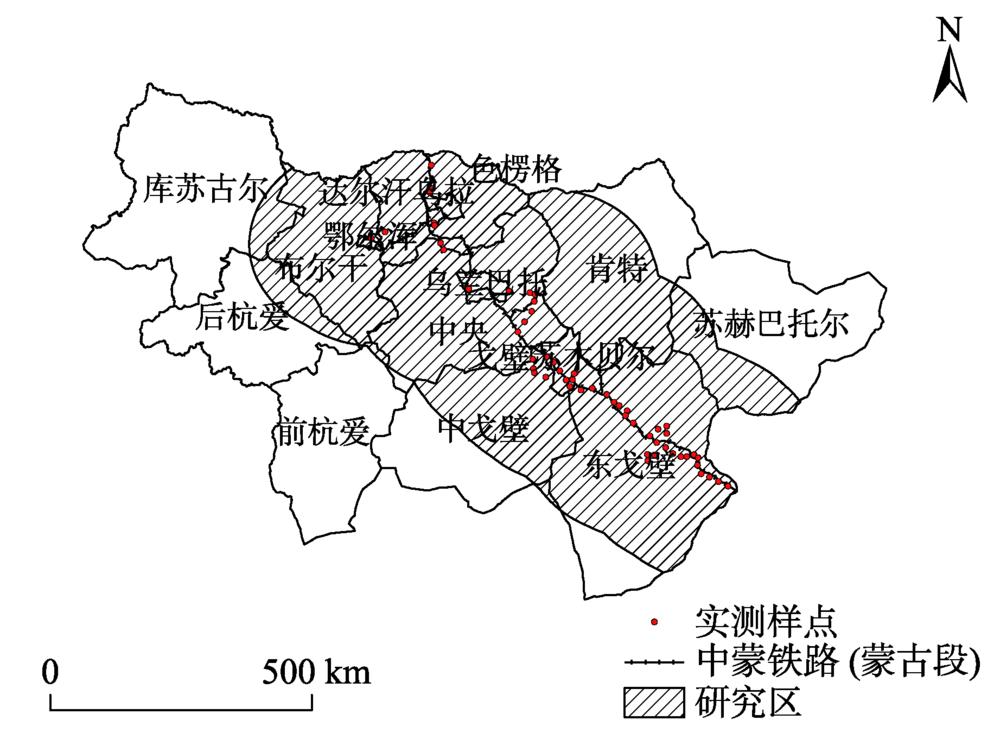
    Fig. 1. 200 km buffer zone along the China-Mongolia Railway (Mongolia)
    Comparison of actual value and estimated value of samples by P-BSHADE and Kriging
    Fig. 2. Comparison of actual value and estimated value of samples by P-BSHADE and Kriging
    Distribution of interpolation samples based on P-BSHADE method
    Fig. 3. Distribution of interpolation samples based on P-BSHADE method
    The spatial distribution of grassland production along the China-Mongolia railway (Mongolia) from 2000 to 2019
    Fig. 4. The spatial distribution of grassland production along the China-Mongolia railway (Mongolia) from 2000 to 2019
    Annual grassland production along the China-Mongolia railway (Mongolia) from 2000 to 2019
    Fig. 5. Annual grassland production along the China-Mongolia railway (Mongolia) from 2000 to 2019
    要素EVINDVIPsnNet
    相关系数0.833**0.863**0.845**
    P0.0000.0000.000
    Table 1. Correlation analysis between grassland production along the China-Mongolia railway (Mongolia) and vegetation indices
    建模参数模型方程R2Sig.RMSE/(kg/hm2精度/%
    NDVI线性模型Y=-12.687+208.515X10.720.00056.8975
    指数模型Y=10.074exp(3.897X10.640.00042.9180
    EVI线性模型Y=-11.687+316.114X20.660.00063.8972
    指数模型Y=10.582exp(5.799X20.570.00048.0578
    PsnNet线性模型Y=6.887+2989.807X30.680.00081.6569
    指数模型Y=17.236exp(50.095X30.550.00060.0373
    Table 2. Estimation models of grassland production along the China-Mongolia railway (Mongolia) based on different vegetation indices and accuracy comparison
    年份单产/(kg/hm²)总产/104 t
    20004063.231862.97
    20014734.252170.49
    20024178.611915.84
    20034603.982110.93
    20044551.332086.81
    20053982.201825.84
    20064721.282164.76
    20073696.651694.92
    20085054.462317.36
    20094741.862174.14
    20104361.111999.63
    20115143.612358.30
    20125790.502654.97
    20135203.052385.58
    20145431.392490.22
    20153758.041723.11
    20165156.342364.27
    20173294.821510.57
    20185092.152334.79
    20194802.512202.00
    平均4618.072117.38
    Table 3. Statistics of annual grassland production along the China-Mongolia Railway (Mongolia) from 2000 to 2019
    Yanjie WANG, Juanle WANG, Haishuo WEI, Ochir ALTANSUKH, Davaasuren DAVAADORJ, Chonokhuu SONOMDAGVA. Study on Estimation Method of Mongolia Grassland Production based on Sparse Samples[J]. Journal of Geo-information Science, 2020, 22(9): 1814
    Download Citation