• Acta Physica Sinica
  • Vol. 69, Issue 8, 084701-1 (2020)
Yue-Tong Wang1, Luo-Ran Shang2、*, and Yuan-Jin Zhao1、*
Author Affiliations
  • 1State Key Laboratory of Bioelectronics, School of Biological Science and Medical Engineering, Southeast University, Nanjing 210096, China
  • 2Zhongshan-Xuhui Hospital, Institutes of Biomedical Sciences, Fudan University, Shanghai 200032, China
  • show less
    DOI: 10.7498/aps.69.20200362 Cite this Article
    Yue-Tong Wang, Luo-Ran Shang, Yuan-Jin Zhao. Surface-textured polymer microspheres generated through interfacial instabilities of microfluidic droplets for cell capture[J]. Acta Physica Sinica, 2020, 69(8): 084701-1 Copy Citation Text show less
    Schematic illustration of the fabrication of polystyrene microspheres with rough surface: (a) Schematic representation of generating uniform emulsion droplets from microfluidic devices; (b) schematic diagram of the formation process of solidified microspheres with surface wrinkles. In the collection dish, the volatilization of chloroform from droplets triggers the interface instability phenomenon, then the surface wrinkles are generated.
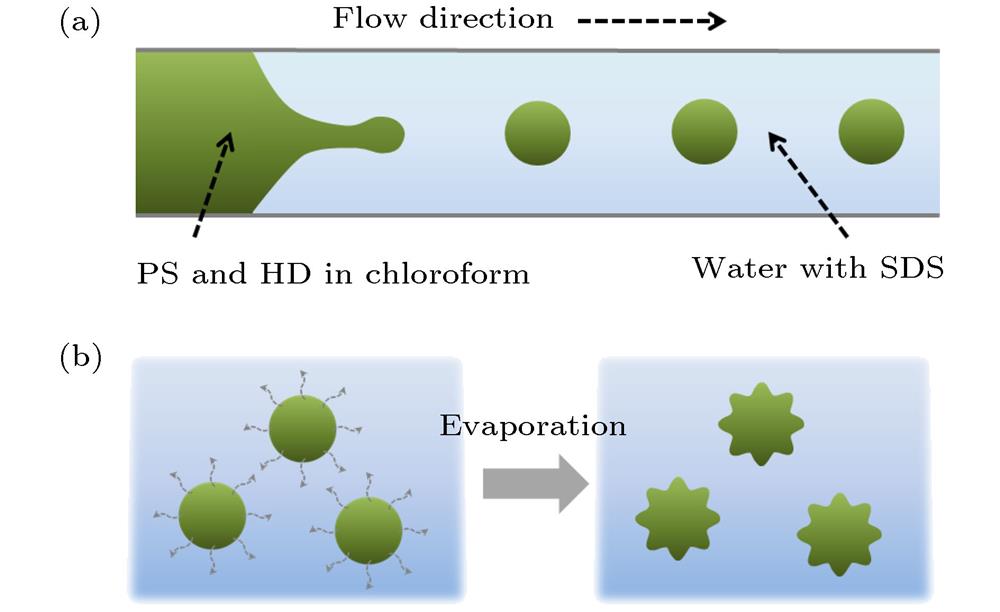
    Fig. 1. Schematic illustration of the fabrication of polystyrene microspheres with rough surface: (a) Schematic representation of generating uniform emulsion droplets from microfluidic devices; (b) schematic diagram of the formation process of solidified microspheres with surface wrinkles. In the collection dish, the volatilization of chloroform from droplets triggers the interface instability phenomenon, then the surface wrinkles are generated.
    (a) Real-time images of droplets generated in the microfluidic device, the scale bar is 600 μm; (b), (c) microscope photographs of the (b) droplets and (c) the resultant PS microparticles. The scale bars are 200 μm in (b) and 80 μm in (c), respectively; (d), (e) Relationships of the droplets radius with (d) the same inner flow rate and (e) the same outer flow rate, respectively. Error bars represent standard deviations.
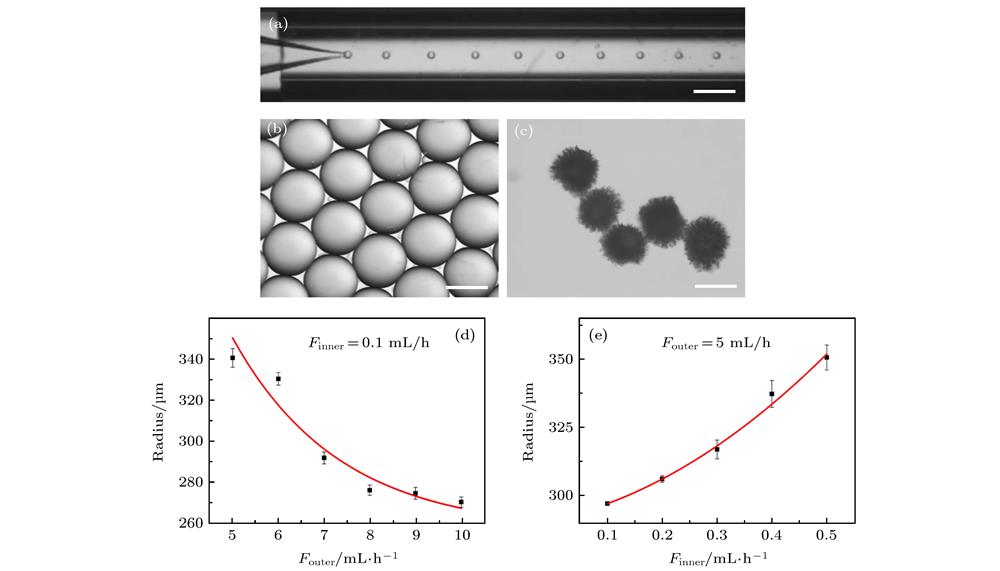
    Fig. 2. (a) Real-time images of droplets generated in the microfluidic device, the scale bar is 600 μm; (b), (c) microscope photographs of the (b) droplets and (c) the resultant PS microparticles. The scale bars are 200 μm in (b) and 80 μm in (c), respectively; (d), (e) Relationships of the droplets radius with (d) the same inner flow rate and (e) the same outer flow rate, respectively. Error bars represent standard deviations.
    Formation process of microspheres with wrinkled surface observed under the microscope. With the evaporation of chloroform, the droplets continue to shrink, and meanwhile, the "ripple-like" substance is produced. Finally, the PS vitrifies to form solidified microspheres. This process lasts about 1 minute at the room temperature. The scale bars are 300 μm in (a)−(f) and 250 μm in (g)−(i), respectively.
    Fig. 3. Formation process of microspheres with wrinkled surface observed under the microscope. With the evaporation of chloroform, the droplets continue to shrink, and meanwhile, the "ripple-like" substance is produced. Finally, the PS vitrifies to form solidified microspheres. This process lasts about 1 minute at the room temperature. The scale bars are 300 μm in (a)−(f) and 250 μm in (g)−(i), respectively.
    The optical microscopy and SEM images of the PS microparticles with different surface-roughness. They are obtained from microfluidic droplet templates containing 10 mg/mL PS and varied concentrations of HD: (a), (d) c = 0 mg/mL; (b), (e) c = 0.5 mg/mL; (c), (f) c = 1 mg/mL; (g), (j) c = 1.5 mg/mL; (h), (k) c = 2 mg/mL; and (i), (l) c = 3 mg/mL. The scale bars are 45 μm in ((a)−(c), (g)−(i)) and 30 μm in ((d)−(f), (j)−(l)), respectively.
    Fig. 4. The optical microscopy and SEM images of the PS microparticles with different surface-roughness. They are obtained from microfluidic droplet templates containing 10 mg/mL PS and varied concentrations of HD: (a), (d) c = 0 mg/mL; (b), (e) c = 0.5 mg/mL; (c), (f) c = 1 mg/mL; (g), (j) c = 1.5 mg/mL; (h), (k) c = 2 mg/mL; and (i), (l) c = 3 mg/mL. The scale bars are 45 μm in ((a)−(c), (g)−(i)) and 30 μm in ((d)−(f), (j)−(l)), respectively.
    Strong mangnetic responsiveness of the highly textured PS microparticles coated with Fe3O4 nanoparticles. Under the gui-dance of the permanent magnet, the microspheres are attracted to the side of the bottle wall near the magnet. The scale bar is 1.5 cm.
    Fig. 5. Strong mangnetic responsiveness of the highly textured PS microparticles coated with Fe3O4 nanoparticles. Under the gui-dance of the permanent magnet, the microspheres are attracted to the side of the bottle wall near the magnet. The scale bar is 1.5 cm.
    The CLSM images of CTC captured onto the surface of the PS microparticles: (a) The cross-section fluorescent images; (b) the white-light images, and (c) the merged images. The scale bar is 30 µm; (d) the relationships of the number of captured cells with the extents of surface wrinkles.
    Fig. 6. The CLSM images of CTC captured onto the surface of the PS microparticles: (a) The cross-section fluorescent images; (b) the white-light images, and (c) the merged images. The scale bar is 30 µm; (d) the relationships of the number of captured cells with the extents of surface wrinkles.
    Yue-Tong Wang, Luo-Ran Shang, Yuan-Jin Zhao. Surface-textured polymer microspheres generated through interfacial instabilities of microfluidic droplets for cell capture[J]. Acta Physica Sinica, 2020, 69(8): 084701-1
    Download Citation