
D. C. Speirs, K. Ronald, A. D. R. Phelps, M. E. Koepke, R. A. Cairns, A. Rigby, F. Cruz, R. M. G. M. Trines, R. Bamford, B. J. Kellett, B. Albertazzi, J. E. Cross, F. Fraschetti, P. Graham, P. M. Kozlowski, Y. Kuramitsu, F. Miniati, T. Morita, M. Oliver, B. Reville, Y. Sakawa, S. Sarkar, C. Spindloe, M. Koenig, L. O. Silva, D. Q. Lamb, P. Tzeferacos, S. Lebedev, G. Gregori, R. Bingham, "Maser radiation from collisionless shocks: application to astrophysical jets," High Power Laser Sci. Eng. 7, 01000e17 (2019)
- High Power Laser Science and Engineering
- Vol. 7, Issue 1, 01000e17 (2019)
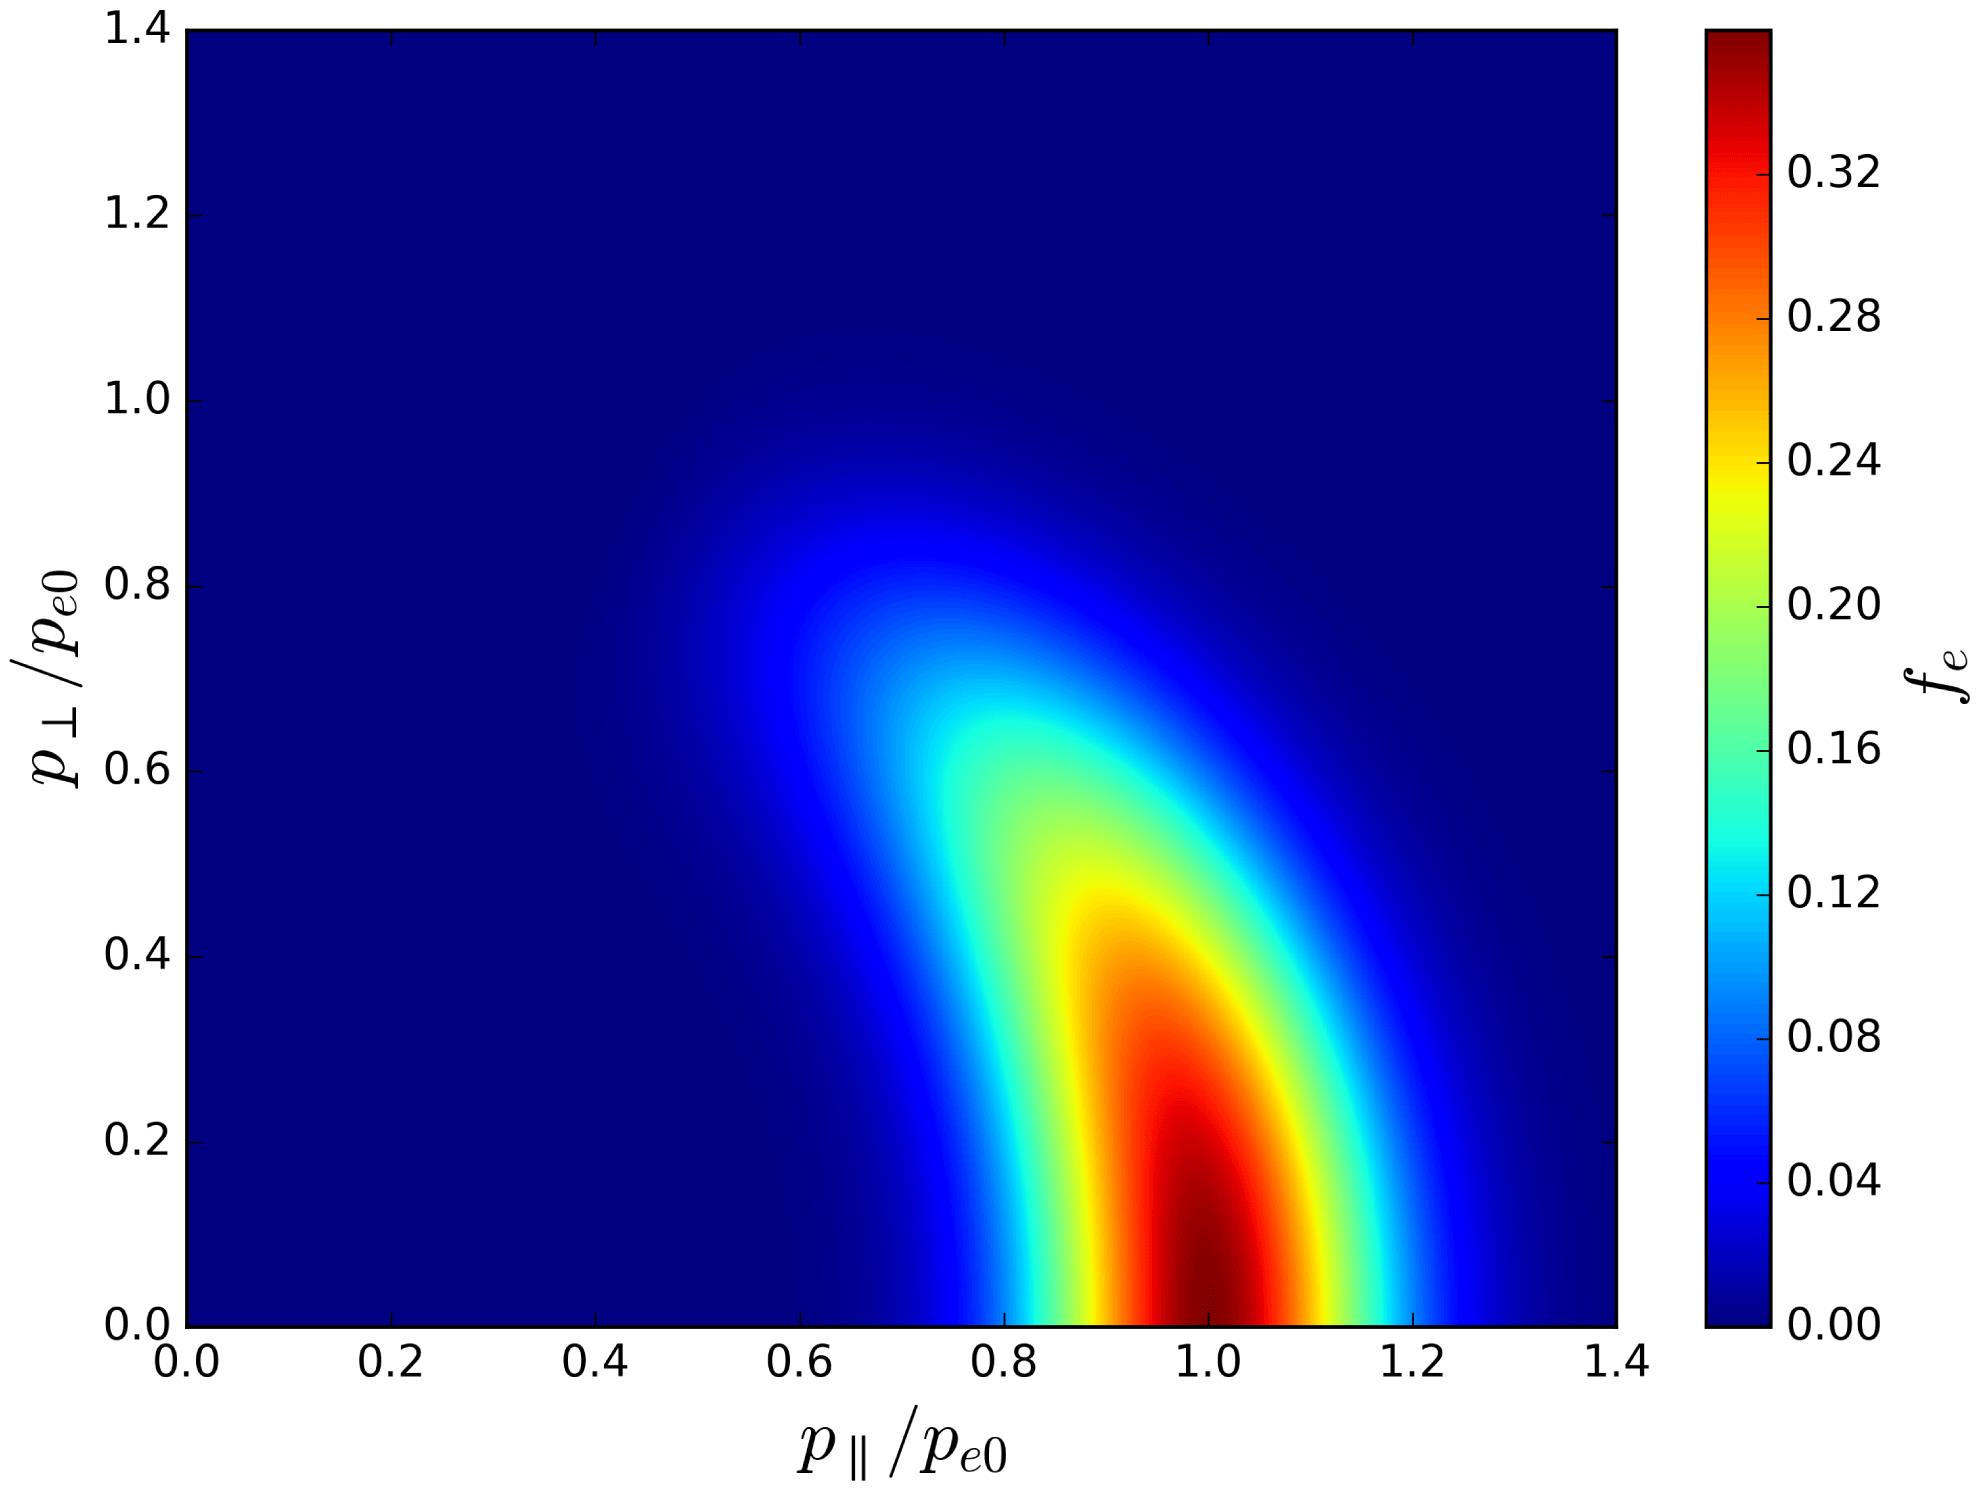
Fig. 1. Perpendicular and parallel components of electron momentum (normalized to the mean electron momentum $p_{e0}$ ) for an evolved horseshoe distribution function, with the contours representing constant phase-space density.
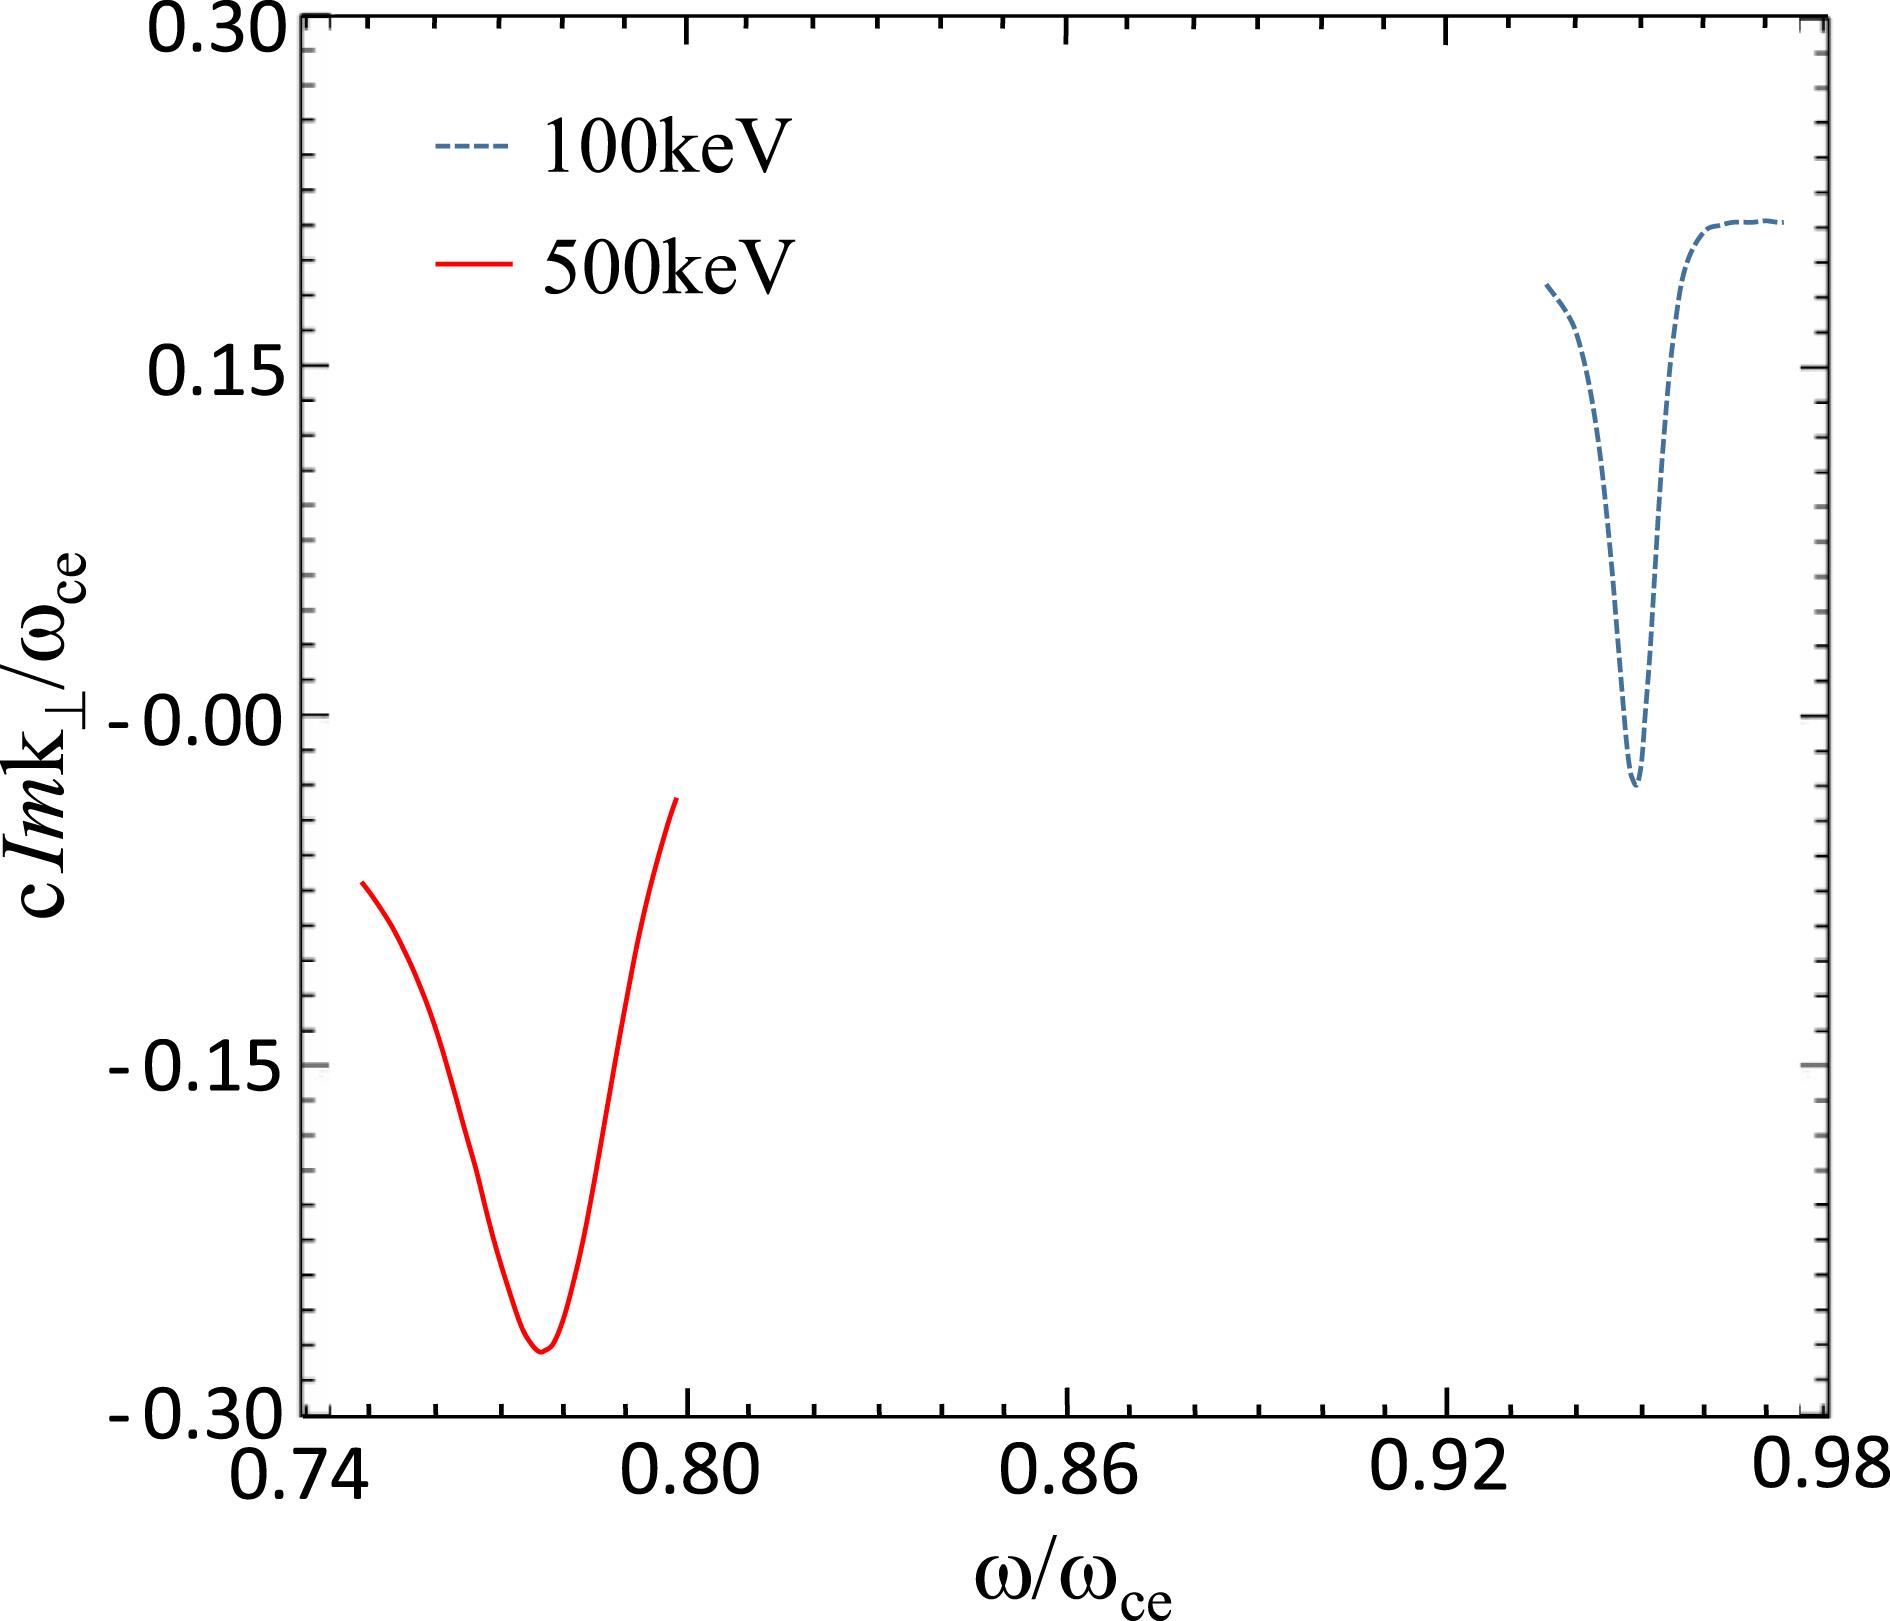
Fig. 2. Imaginary part of the refractive index as a function of frequency for a mean beam energy of 100 keV and a thermal spread of 1 keV, and a mean beam energy of 500 keV and a thermal spread of 5 keV. The magnetic field ratio is taken to be 20.
Fig. 3. Composite overview of 3D VSim PIC simulation results in an $x$ –$z$ plane ($y=0$ ) showing magnetic compression of an electron beam and subsequent cyclotron-maser emission in the X-mode at $t=1000t_{ce}$ . The electron PIC particle trajectory is also overlaid (blue scatter plot) along with the corresponding velocity distribution over the simulation volume at $t=1000t_{ce}$ .
Fig. 4. 3D VSim PIC simulation results showing (a) the spectrum of EM emission at $z=86\unicode[STIX]{x1D706}_{ce}$ and (b) the transverse Poynting flux in a $y$ –$z$ plane displaced from the electron beam.
Fig. 5. Diagrammatic overview of the experimental setup showing the magnetic coil configuration, electron gun and the convergent axial magnetic field profile with peak-plateau region for cyclotron resonant energy transfer.
Fig. 6. Experimental measurements for the TE01 resonance, illustrating the spectrum of the output signal, displaying a strong resonance close to the electron-cyclotron frequency, 4.42 GHz.


Set citation alerts for the article
Please enter your email address

© Copyright 2018-2021 | Chinese Laser Press. All Rights Reserved 沪ICP备15018463号-20