
Xiao Zhengying. Numerical Simulation of Endovenous Laser Ablation with Radial 2Ring Fiber[J]. Chinese Journal of Lasers, 2020, 47(12): 1207001
- Chinese Journal of Lasers
- Vol. 47, Issue 12, 1207001 (2020)
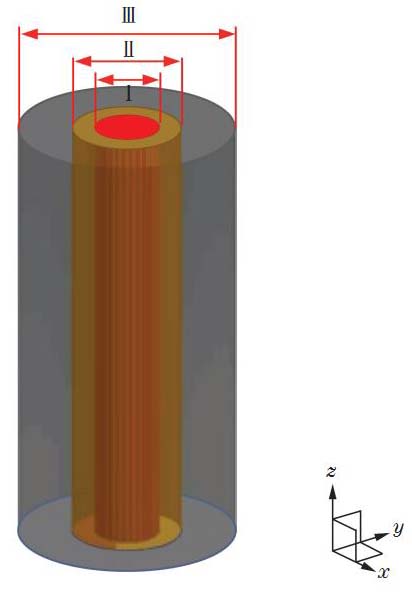
Fig. 1. Diagram of the vein and its surrounding tissues, including blood (zone Ⅰ), venous wall (zone Ⅱ), and perivenous tissue (zone Ⅲ)
![The radial 2ring fiber. (a) Photomicrogragh of the tip of the radial 2ring fiber[11]; (b) simulation model for estimation](/richHtml/zgjg/2020/47/12/1207001/img_2.jpg)
Fig. 2. The radial 2ring fiber. (a) Photomicrogragh of the tip of the radial 2ring fiber[11]; (b) simulation model for estimation
Fig. 3. Change of maximal temperature that is higher than initial temperature, λ=1470nm. (a) P=4.8W; (b) P=12.8W
Fig. 4. Temperature change at each probe location, λ=1470nm, P=5W, v=1m/s, Ed =50J/cm. (a) Radial fiber; (b) radial 2ring fiber
Fig. 5. The proportion of necrotic tissue in the vein and its surrounding tissues, λ=1470m, P=5W, v=1m/s, Ed=50J/cm.(a) Radial fiber, yz medium section, x=0; (b) radial fiber, xy medium section, z=40m; (c) radial 2ring fiber, yz medium section, x=0; (d) radial 2ring fiber, xy medium section, z=40m
Fig. 6. The proportion of necrotic tissue in vein and surrounding tissues under radial 2ring fiber irradiation,λ=1470nm, v=2mm/s. (a) P=5W, yz middle section, x=0, Ed = 25J/cm; (b) P=5W, xy medium section, z=40mm, Ed =25J/cm; (c) P=10W, yz middle section, x=0, Ed =50J/cm; (d) P=10W, xy medium section, z=40mm, Ed =50J/cm
Fig. 7. Temperature changes at each probe location, λ=1470nm, v=2mm/s. (a) P=5W, Ed=25J/cm; (b) P=10W, Ed =50J/cm
Fig. 8. Dynamic and static thermophysical parameters numerical simulation of radial 2ring fiber irradiation,λ=1470nm, P=5W, v=1mm/s
Fig. 9. The proportion of necrotic tissue in the vein and its surrounding tissues. The inner diameter of the vein is 5mm, λ=1470nm, P=10W, v=1mm/s, Ed=100J/cm. (a) yz medium section, x=0; (b) xy medium section, z=40mm
|

Set citation alerts for the article
Please enter your email address
© Copyright 2018-2021 | Chinese Laser Press. All Rights Reserved 沪ICP备15018463号-20