
Michael Valdman, Amir Hen, Gilad Marcus, "A GHz chirped amplitude-modulated laser for high-contrast plasma gratings," High Power Laser Sci. Eng. 12, 010000e8 (2024)
- High Power Laser Science and Engineering
- Vol. 12, Issue 1, 010000e8 (2024)
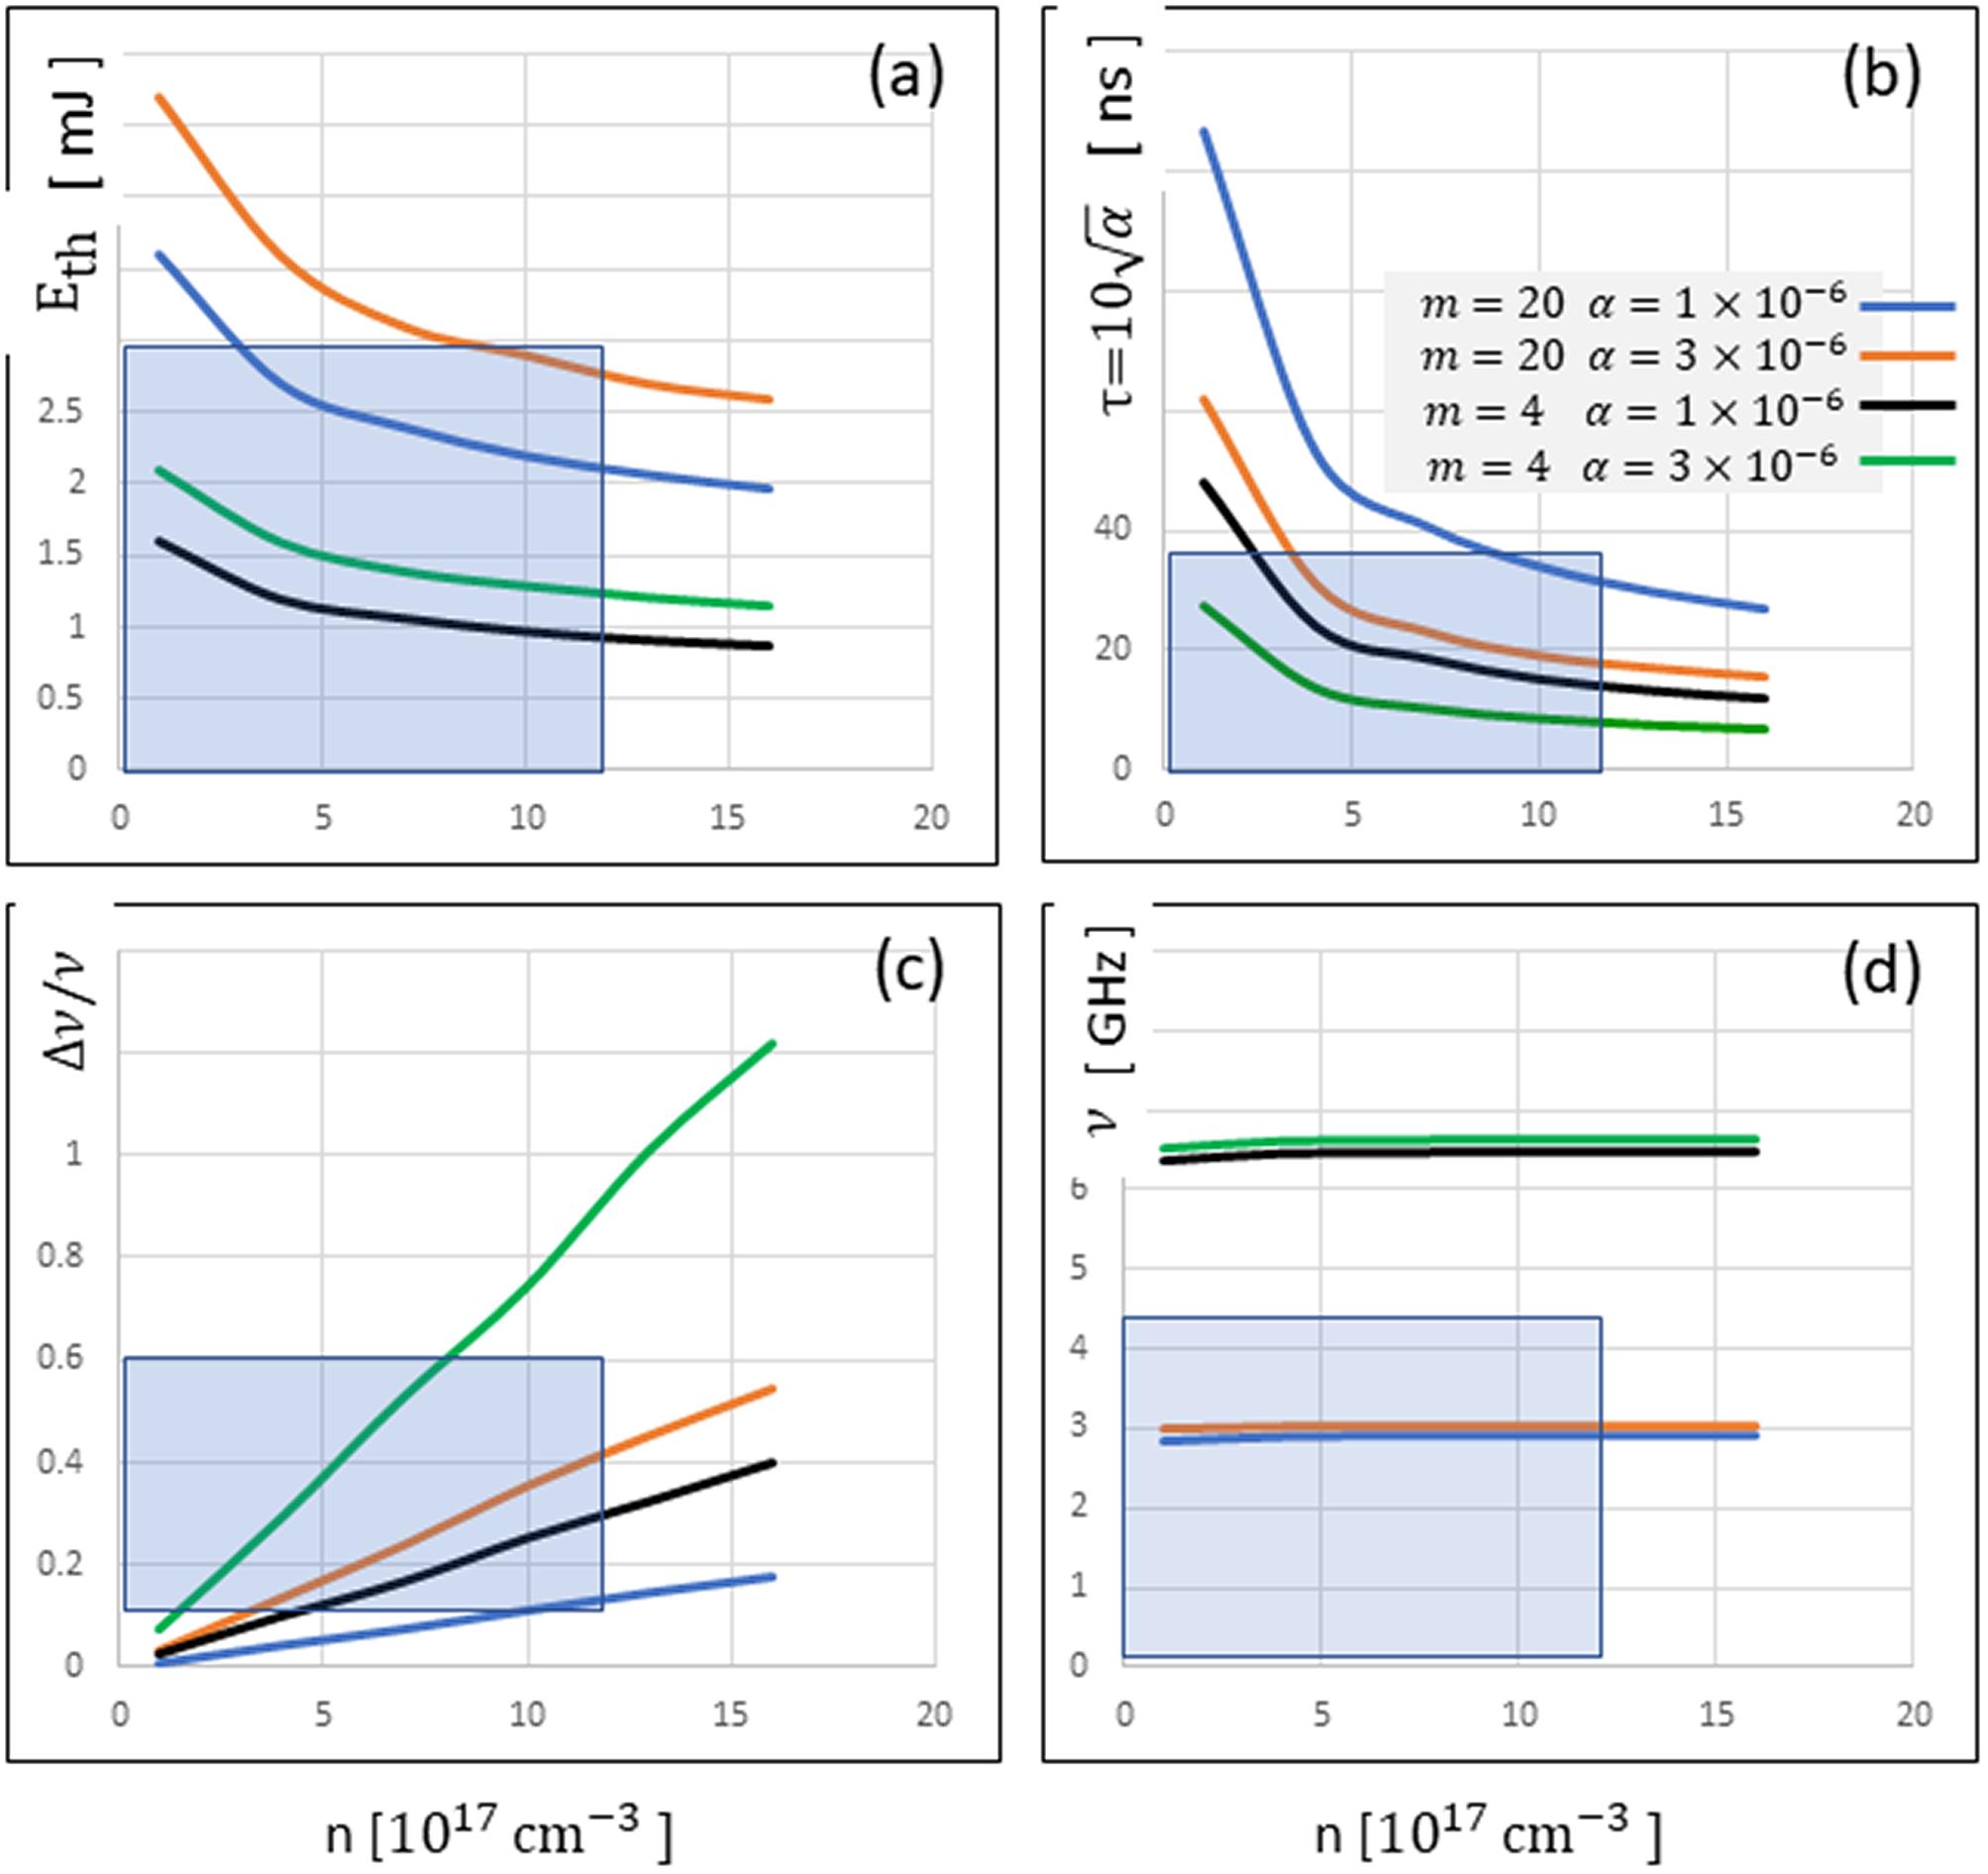
Fig. 1. A selection chart for the best experimental conditions. (a) The pulse energy threshold (in mJ) as a function of the plasma density (in units of  ), assuming a beam waist of
  . (b) The time window
  (in ns) as a function of the plasma density. (c) The swept bandwidth within the time window of 35 ns. (d) The linear ion acoustic wave frequency (GHz). The laser wavelength is chosen to be
  and the electron temperature is 0.5 eV. Orange and blue lines represent the ion mass of 20 a.u. (neon) and the dimensionless chirp rate of
  or
or  , respectively. Green and black lines represent the ion mass of 4 a.u. (helium) and the dimensionless chirp rate of
  or
or  , respectively.
), assuming a beam waist of . (b) The time window (in ns) as a function of the plasma density. (c) The swept bandwidth within the time window of 35 ns. (d) The linear ion acoustic wave frequency (GHz). The laser wavelength is chosen to be and the electron temperature is 0.5 eV. Orange and blue lines represent the ion mass of 20 a.u. (neon) and the dimensionless chirp rate of or , respectively. Green and black lines represent the ion mass of 4 a.u. (helium) and the dimensionless chirp rate of or , respectively. ![(a) Schematic of cavity design. M1, spherical front end-mirror with radius of 3 m; L1, 63 mm; PC, Pockels cell; L2, 60 mm; QWP, quarter waveplate; L3, 340 mm; L4, 10 mm; lens, focal length −750 mm; L5, 500 mm; Nd:YAG, gain medium; iM, removable flat mirror used as the back end-mirror of the short cavity; L6, 1.1 m; M2 and M3, spherical mirrors with radius of 2 m; L7, 2 m; L8, 1 m; M4, flat mirror used as the end-mirror of the long cavity. (b) Caustic of the beam inside the cavity obtained from simulations with ReZonator 2[24" target="_self" style="display: inline;">24].](/richHtml/hpl/2024/12/1/010000e8/img_2.png)
Fig. 2. (a) Schematic of cavity design. M1, spherical front end-mirror with radius of 3 m; L1, 63 mm; PC, Pockels cell; L2, 60 mm; QWP, quarter waveplate; L3, 340 mm; L4, 10 mm; lens, focal length −750 mm; L5, 500 mm; Nd:YAG, gain medium; iM, removable flat mirror used as the back end-mirror of the short cavity; L6, 1.1 m; M2 and M3, spherical mirrors with radius of 2 m; L7, 2 m; L8, 1 m; M4, flat mirror used as the end-mirror of the long cavity. (b) Caustic of the beam inside the cavity obtained from simulations with ReZonator 2[24].
Fig. 3. The cavity stability parameter as a function of the effective thermal lensing (black). The red lines indicate the limits of stability.
Fig. 4. Electronic signal from the AWG (top) chirped from 1 to 0.77 GHz, and amplified optical pulse at 400 Hz repetition rate and averaged power of 910 mW.
Fig. 5. The same as Figure 4 , but for frequencies spanning from 2 to 1.2 GHz.
Fig. 6. The same as Figures 4 and 5 , but for frequencies spanning from 3 to 2 GHz.
Fig. 7. The ratio between the AR threshold for the finite beam width to the AR threshold for the case of a plane wave. Here, q = 2/r max and κ0 is the absolute value of the plane-wave wave-vector. It shows that only at tight focusing (q /κ0 > 0.7) does the finite beam width start to play a significant role.


Set citation alerts for the article
Please enter your email address

© Copyright 2018-2021 | Chinese Laser Press. All Rights Reserved 沪ICP备15018463号-20