• Acta Physica Sinica
  • Vol. 68, Issue 17, 174301-1 (2019)
De-Zhi Kong1、2, Chao Sun1、2、*, Ming-Yang Li1、2, Jie Zhuo1、2, and Xiong-Hou Liu1、2、3
Author Affiliations
  • 1School of Marine Science and Technology, Northwestern Polytechnical University, Xi’an 710072, China
  • 2Key Laboratory of Ocean Acoustics and Sensing Ministry of Industry and Information Technology, Xi’an 710072, China
  • 3State Key Laboratory of Acoustics, Institute of Acoustics, Chinese Academy of Sciences, Beijing 100190, China
  • show less
    DOI: 10.7498/aps.68.20190700 Cite this Article
    De-Zhi Kong, Chao Sun, Ming-Yang Li, Jie Zhuo, Xiong-Hou Liu. Dimension-reduced generalized likelihood ratio detection based on sampling of normal modes in deep ocean[J]. Acta Physica Sinica, 2019, 68(17): 174301-1 Copy Citation Text show less
    The output SNR of EVD varying with various snapshot number and spatial dimension, : (a) spatial dimension ; (b) snapshot number .EVD的输出信噪比随接收数据快拍数和空间维度的变化曲线, (a) 固定空间维度; (b) 固定快拍数
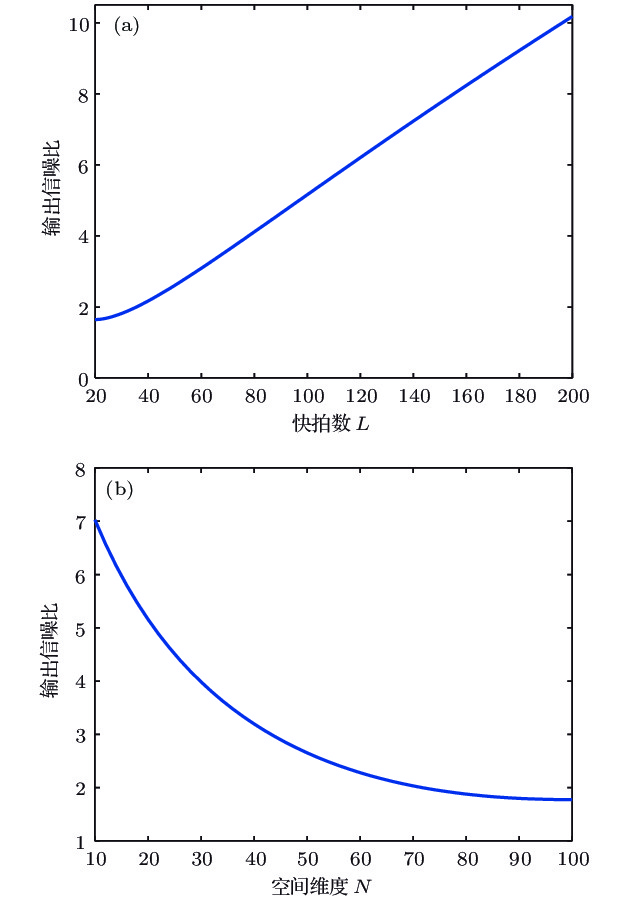
    Fig. 1. The output SNR of EVD varying with various snapshot number and spatial dimension, : (a) spatial dimension ; (b) snapshot number . EVD的输出信噪比随接收数据快拍数和空间维度的变化曲线,  (a) 固定空间维度 ; (b) 固定快拍数
    The flow diagrams of the DR-GLR detectors when using a VLA使用VLA时DR-GLR检测器的算法流程图
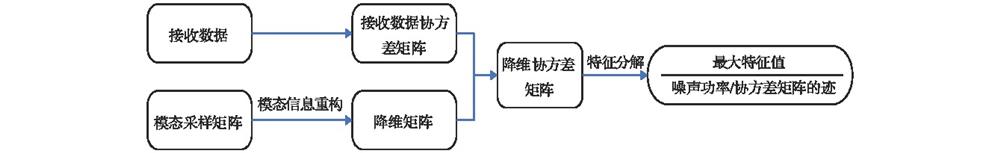
    Fig. 2. The flow diagrams of the DR-GLR detectors when using a VLA使用VLA时DR-GLR检测器的算法流程图
    The arrival angle of acoustic signal on the HLA.水平阵声源信号入射方位
    Fig. 3. The arrival angle of acoustic signal on the HLA.水平阵声源信号入射方位
    The flow diagrams of the DR-GLR detectors when using a HLA.使用HLA时DR-GLR检测器的算法流程图
    Fig. 4. The flow diagrams of the DR-GLR detectors when using a HLA.使用HLA时DR-GLR检测器的算法流程图
    Deep-sea waveguide and environmental parameters深海波导及相关环境参数
    Fig. 5. Deep-sea waveguide and environmental parameters深海波导及相关环境参数
    Deep-sea sound speed profile.深海声速剖面
    Fig. 6. Deep-sea sound speed profile.深海声速剖面
    Probability of detection curves with various SNRs, = 0.01: (a) ; (b) .不同信噪比下检测概率曲线比较, = 0.01 (a) ; (b)
    Fig. 7. Probability of detection curves with various SNRs, = 0.01: (a) ; (b) . 不同信噪比下检测概率曲线比较, = 0.01 (a) ; (b)
    Probability of detection curves with various SNRs when noise power is uncertain: (a) ; (b) .噪声功率不确定, 不同信噪比下检测概率曲线比较 (a); (b)
    Fig. 8. Probability of detection curves with various SNRs when noise power is uncertain: (a) ; (b) . 噪声功率不确定, 不同信噪比下检测概率曲线比较 (a) ; (b)
    Probability of detection curves with various spatial dimension: (a) EVD; (b) CEVD.不同数据维度下的检测概率曲线对比, 快拍数(a) EVD; (b) CEVD
    Fig. 9. Probability of detection curves with various spatial dimension: (a) EVD; (b) CEVD.不同数据维度下的检测概率曲线对比, 快拍数  (a) EVD; (b) CEVD
    Modal information sampled on the array and singular values of corresponding mode matrices: (a) Various modes sampled on the VLA; (b) normalized singular values associated with the VLA; (c) various modes sampled on the HLA; (d) normalized singular values associated with the HLA.阵列采样模态信息及相应模态矩阵的奇异值 (a) VLA采样的各阶模态; (b) VLA; 归一化的各阶奇异值分布; (c) HLA采样的各阶模态; (d) HLA, 归一化的各阶奇异值分布
    Fig. 10. Modal information sampled on the array and singular values of corresponding mode matrices: (a) Various modes sampled on the VLA; (b) normalized singular values associated with the VLA; (c) various modes sampled on the HLA; (d) normalized singular values associated with the HLA.阵列采样模态信息及相应模态矩阵的奇异值 (a) VLA采样的各阶模态; (b) VLA; 归一化的各阶奇异值分布; (c) HLA采样的各阶模态; (d) HLA, 归一化的各阶奇异值分布
    Probability of detection curves of different detectors, snapshot number : (a) VLA; (b) HLA.不同信噪比下的检测概率曲线对比, 快拍数(a) VLA; (b) HLA
    Fig. 11. Probability of detection curves of different detectors, snapshot number : (a) VLA; (b) HLA. 不同信噪比下的检测概率曲线对比, 快拍数  (a) VLA; (b) HLA
    Probability of detection curves of different detectors when noise power is uncertain, snapshot number : (a) VLA; (b) HLA.噪声功率不确定, 不同信噪比下检测概率曲线对比, 快拍数(a) VLA; (b) HLA
    Fig. 12. Probability of detection curves of different detectors when noise power is uncertain, snapshot number : (a) VLA; (b) HLA. 噪声功率不确定, 不同信噪比下检测概率曲线对比, 快拍数  (a) VLA; (b) HLA
    Modal functions and horizontal wavenumber of various normal modes excited by the acoustic source: (a) Modal functions along with various depths; (b) distribution of various horizontal wavenumbers.声源激发的各阶简正波模态函数和水平波数 (a)各阶模态函数幅值随波导深度的变化; (b)各阶水平波数分布
    Fig. 13. Modal functions and horizontal wavenumber of various normal modes excited by the acoustic source: (a) Modal functions along with various depths; (b) distribution of various horizontal wavenumbers.声源激发的各阶简正波模态函数和水平波数 (a)各阶模态函数幅值随波导深度的变化; (b)各阶水平波数分布
    The influence of array configuration on the degree of dimension reduction, : (a) Array depth of 100 m; (b) hydrophone spacing of 4 m.阵列配置对降维程度的影响, (a) 阵列深度100 m; (b) 阵元间距4 m
    Fig. 14. The influence of array configuration on the degree of dimension reduction, : (a) Array depth of 100 m; (b) hydrophone spacing of 4 m. 阵列配置对降维程度的影响,  (a) 阵列深度100 m; (b) 阵元间距4 m
    The dimension reduction coefficient varying with increasing frequency.降维系数随声源频率的变化曲线
    Fig. 15. The dimension reduction coefficient varying with increasing frequency.降维系数随声源频率的变化曲线
    De-Zhi Kong, Chao Sun, Ming-Yang Li, Jie Zhuo, Xiong-Hou Liu. Dimension-reduced generalized likelihood ratio detection based on sampling of normal modes in deep ocean[J]. Acta Physica Sinica, 2019, 68(17): 174301-1
    Download Citation