High-power fiber-to-fiber coupling is extensively used in fiber laser applications, and its performance is determined by coupling efficiency. We demonstrate a novel method for alignment and monitoring efficiency by detecting backscattering power at the fiber end cap. The relationship between alignment error and backscattering power is determined by simulations and experiments. Through this method, a state-of-the-art kW-level fiber-to-fiber optic switch is developed (transmission efficiency >97%). It performs well for longer than 60 min. To the best of our knowledge, it is the first time to establish the mathematical model based on this method. Our results can provide guidance in high-power fiber-to-fiber coupling.
In recent years, high-power fiber lasers have developed rapidly[1,2], and are being extensively used in scientific research, industrial manufacturing, and military defense[3,4]. In order to enrich laser performance, high-power fiber-to-fiber coupling is generally applied to couple beams in free space into fibers for propagation. The key factor that determines the performance of high-power fiber-to-fiber coupling is coupling efficiency. High coupling efficiency indicates that the beam is well coupled with low power loss. Low coupling efficiency indicates that part of the beam is not coupled into the fiber core, with a lot of laser energy leakage. Leaked energy can easily burn the fiber and other devices. Therefore, the beam must be totally coupled into the fiber core to ensure a high coupling efficiency. In the process of coupling, the alignment error has a great influence on the coupling efficiency. When the alignment error is excessive, the beam deviates from the fiber core, which rapidly decreases the coupling efficiency. Thus, it is necessary to control the alignment error within a reasonable range.
In applications of high-power fiber-to-fiber coupling, fibers need to be replaced according to different requirements. The fiber core is narrow, and alignment errors occur easily when the fiber is inserted or pulled out. After replacing fibers, the coupling efficiency should be measured. Alignment needs to be performed if the coupling efficiency decreases. In traditional methods, a power meter is generally used to measure the power of the output fiber and compare it with the input power to obtain the coupling efficiency. Generally, one end of the fiber connects to the coupling system, and the other end, called the output end, connects to other devices. The output end needs to be pulled out to measure the power. Meanwhile, a power meter, which can measure a high-power laser, is generally bulky and requires water cooling. Thus, it is very inconvenient to measure the output power of fiber.
The stability of a coupling system is affected by the environment, especially vibration. It can cause a slight change of the system and result in alignment error. When alignment error is obvious, the coupling efficiency decreases[5]. Users cannot determine the laser energy leakage promptly, and it may bring safety hazards. Therefore, it is crucial to monitor the coupling efficiency for safe use. However, the output fiber is working all the time. It is impossible to use a power meter to measure the output power without disturbing the operation of the fiber.
Sign up for Chinese Optics Letters TOC. Get the latest issue of Chinese Optics Letters delivered right to you!Sign up now
In this Letter, we demonstrate a novel method for alignment and monitoring efficiency by detecting backscattering power at the fiber end cap in high-power fiber-to-fiber coupling. A mathematical model of backscattering power is established. The relationship between the alignment error and backscattering power is determined. Simulations and experiments are performed to verify the correctness of the model and the feasibility of the method. A state-of-art kW-level fiber-to-fiber optic switch (FFOS) (transmission efficiency >97%) is developed based on this method. Furthermore, it performs well for longer than 60 min in testing.
In high-power fiber-to-fiber coupling, large-core double-cladding fibers are generally used for propagation. These fibers are equipped with end caps and mode strippers to transmit a high-power laser. A quartz block is used as the end cap to increase the output power threshold and reduce power loss. In order to equip end caps on the fibers and fabricate mode strippers, a section of fiber coating is removed, and the cladding is exposed in the air. Hydrofluoric acid (HF) is generally used to etch the cladding to form a mode stripper for stripping the cladding light[6–9].
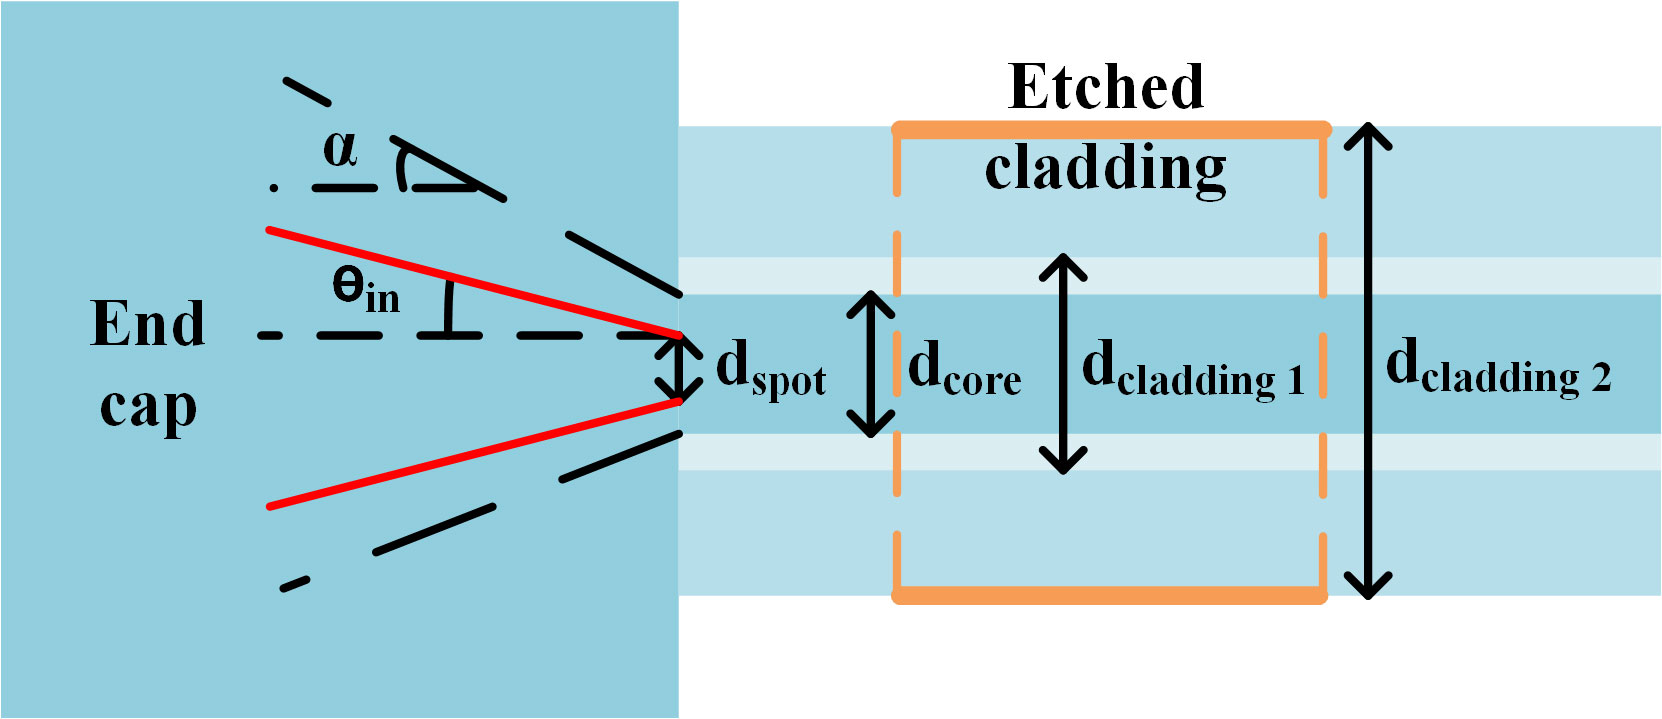
The position of the coupling spot on the end cap-fiber interface is shown in Fig. 1. The fiber includes the core, inner cladding, and outer cladding (diameter of core , diameter of inner cladding , diameter of outer cladding ). The spot (diameter of spot , incident angle ) must be coupled to the fiber core (receiving angle of the core ). When , , and the entire spot is in the core, the beam is well coupled to the fiber and the coupling efficiency is high[10–12]. If the alignment error cannot be ignored, the beam is coupled to claddings and generates cladding light[13].
Figure 1.Position of the coupling spot on the end cap-fiber interface.
When the outer cladding is etched, the surface roughness increases. Scattering occurs when cladding light is incident on the etched cladding. According to Beckmann’s scalar scattering theory[14,15], the scattering coefficient of the rough surface can be expressed as where is the reflection coefficient of a perfectly smooth surface, is the root mean square (RMS) roughness of the etched surface, is the incident angle on the etched surface, and is the wavelength of the incident light. When light hits smooth cladding, no scattering occurs. Thus, the modified scattering coefficient can be expressed as Eq. (2):
For multimode fibers with a step refractive index, we use ray theory to study the relationship between the alignment error and backscattering power. The fiber is a rotationally symmetrical structure, and the propagation of light on the meridian plane is considered in the model.
In the coupling alignment, backscattering occurs at the end cap, which is caused by scattering of the cladding light and the reflected light on the end cap-fiber interface. Figure 2 depicts the light incident on the fiber end face (half cross section). The beam consists of many rays with different incident angles. These rays may hit the outer cladding, inner cladding, and core. The red solid rays represent light propagation in the outer cladding, the yellow solid rays represent light propagation in the inner cladding, the violet solid rays represent light propagation in the fiber core, the green dashed rays represent scattered light, and the blue dashed rays represent reflected light. Here, is the length of the fiber between the end cap and the etched cladding, is the length of the etched cladding, is the radius of the core, is the depth of the inner cladding, and is the depth of the outer cladding.
Figure 2.Light incident on the fiber end face (half cross section).
The total backscattering power consists of the backscattering power , , and of light respectively hitting the core, inner cladding, and outer cladding. When light is incident on the end cap-core interface (the violet solid rays in Fig. 2), it enters the core and satisfies the total internal reflection condition. No light hits the etched cladding, and backscattering occurs due to the interface reflection. The backscattering power can be expressed as where (, ) is the range of incident angle on the core, is the reflection coefficient of the end cap-core interface, and is the power of each incident ray.
When light is incident on the end cap-inner cladding interface (the yellow solid rays in Fig. 2), the reflected light is backward and transmitted light enters the outer cladding. When transmitted light hits the etched cladding it is scattered and part of the scattered light propagates backward. The power of the light entering the outer cladding is where is the reflection coefficient of the end cap-inner cladding interface, is the reflection coefficient of the inner cladding-core interface, is the reflection coefficient of the inner cladding-outer cladding interface, and and , respectively, represent the times that light is reflected on the inner cladding-core interface and inner cladding-outer cladding interface. When the incident angle of the backscattered light on the outer cladding-air interface is greater than the total reflection angle , the backscattered light is transmitted back to the end cap, and the ratio of the backscattered light is . Therefore, the backscattering power can be expressed as where (,) is the range of incident angle on the inner cladding.
When light is incident on the end cap-outer cladding interface (the red solid rays in Fig. 2), the reflected light is backward, and part of transmitted light hits the etched cladding. The power of the light entering the outer cladding is where is the reflection coefficient of the end cap-outer cladding interface. Therefore, the backscattering power can be expressed as where (, ) is the range of incident angle on the outer cladding.
Figure 3.Relationship between the normalized backscattering power and the offset of the spot center in the (a) outer cladding, (b) inner cladding, and (c) core.
The total backscattering power is the sum of , , and , and it can be expressed as Eq. (8):
Different positions of the spot center on the end face of the fiber indicate different alignment errors. The spot center might be located in the outer cladding, inner cladding, and core in alignment. The relationship between the normalized backscattering power and the offset of the spot center is shown in Fig. 3, assuming , incident angle 0.07 rad, 100/120/360 fiber, , , , and . The blue dashed lines (in Fig. 3) represent the initial position of the spot center. When the offset of the spot center in the outer cladding is positive (close to the fiber core), the backscattering power increases to a high value, and then decreases to a low value; when the offset is negative (away from fiber core), the backscattering power increases extremely, as shown in Fig. 3(a). When the offset of the spot center in the inner cladding is positive (close to the fiber core), the backscattering power decreases to a low value; when the offset is negative (away from fiber core), the backscattering power increases to a high value and then decreases to a moderate value, as shown in Fig. 3(b). When the offset of the spot center in the core is positive (away from fiber core), the backscattering power increases to a high value, and then decreases to a moderate value; when the offset is negative (away from fiber core), the change of the backscattering power is the same, as shown in Fig. 3(c). In the above process, the lowest value indicates that the beam is well coupled.
The results indicate that the position of the spot center can be judged only by the backscattering power. Alignment can be achieved according to the change of the backscattering power in Fig. 3. When the spot is totally in the core, the backscattering power is the lowest. The increase of backscattering power indicates that alignment error occurs and coupling efficiency decreases. Thus, the efficiency can be monitored by detecting the backscattering power.
Different fibers indicate different stripper parameters, including , , and . Different coupling systems indicate different spot sizes. The relationship between normalized backscattering power and these factors is shown in Fig. 4, when the spot center in the core deviates from different distances. The influence of , , , and on the backscattering power is, respectively, shown in Figs. 4(a)–4(d). These factors can affect the backscattering power, but they have little effect on the variation trend of it when an alignment error occurs. The results indicate that different fibers and coupling systems do not affect alignment and efficiency-monitoring based on the demonstrated method.
Figure 4.Relationship between the normalized backscattering power and (a) , (b) , (c) , and (d) .
An experiment is performed to verify the relationship between the alignment error and the backscattering power. The outer cladding of the output fiber is etched by HF ( and ). The measurement value of the RMS roughness is 147.87 nm through a Veeco NT9100 optical profiler, as shown in Fig. 5.
Figure 5.Measurement result of the etched-cladding roughness.
The experimental system is shown in Fig. 6. The laser is a custom-made CW fiber laser (central wavelength 1080 nm, 20/400 input fiber, NA 0.065), and the coupling system is composed of a collimating lens (focal length 50 mm) and a focusing lens (focal length 50 mm). Power meter 1 (Ophir, 3 W, Israel) is used to measure the backscattering power at end cap 2 of the output fiber (100/120/360 fiber, NA 0.22). Power meter 2 (Ophir, 250 W, Israel) is used to measure the output power of end cap 3. A shelter is placed between the etched fiber and power meter 1 to prevent other scattering light from affecting the measurement.
The backscattering power and output power are measured when the spot center in the core deviates at different distances. The comparison of the test results and simulation results is shown in Fig. 7. The input power is 7.14 W, and when the beam is well coupled the output power is 6.97 W (coupling efficiency 97.6%), with a low backscattering power. When the beam deviates from the core, the backscattering power and output power change correspondingly at the same time. The measurement results are basically consistent with the simulation results. Thus, the correctness of the mathematical model and the feasibility of the method are verified.
Figure 7.Comparison of the test results and simulation results of the verification experiment.
Through this method, a kW-level FFOS is developed. The schematic of the FFOS is shown in Fig. 8. The coupling system is composed of a collimating lens and focusing lenses. Switching mirror 1 and switching mirror 2 are used to select the optical channel. The beam dump absorbs the residual beam passing through the switching mirror.
The homemade FFOS is shown in Fig. 9. It can couple the beam of a fiber laser to different channels according to requirements. Its model structure is shown in Fig. 9(a), and the physical structure is shown in Fig. 9(b).
Figure 9.Homemade FFOS: (a) model structure, (b) physical structure.
The fiber laser and output fiber in Fig. 6 are used in FFOS. The mechanical structure ensures the basic position of the optical elements, and alignment is performed at a low power (∼20 W) by detecting the backscattering power. The laser power increases gradually, and a high-power propagation is realized with no adjustment. The test results of FFOS are shown in Fig. 10. The transmission efficiency (∼97%) is basically stable from low power to high power, as shown in Fig. 10(a). When the input power is 1014 W, the output power is 986 W (transmission efficiency 97.2%). Furthermore, it was tested for a long time at a high power, as shown in Fig. 10(b). The output power (∼986 W) of the FFOS maintains stability for longer than 60 min, and the backscattering power is almost unchanged.
Figure 10.Test results of the FFOS: (a) power and efficiency, (b) long-time stability.
In conclusion, we have demonstrated a novel method for alignment and efficiency-monitoring in high-power fiber-to-fiber coupling by detecting the backscattering power at the fiber end cap. A mathematical model of the backscattering power is established. Then the relationship between the alignment error and backscattering power is determined. Moreover, the effects of different output fibers and coupling systems on the backscattering power are analyzed. Simulations and experiments both verify the correctness of the model and the feasibility of the method. Based on the demonstrated method, we have developed a state-of-art kW-level FFOS. The transmission efficiency is >97% (input power is 1014 W, output power is 986 W). Furthermore, it maintains a good state for longer than 60 min (output power ∼986 W). To the best of our knowledge, it is the first time to establish a mathematical mode based on the method. Our results can provide guidance for the research of high-power fiber-to-fiber coupling.