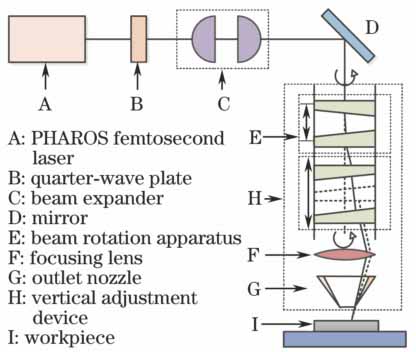
Fig. 1. Schematic diagram of femtosecond laser machining system
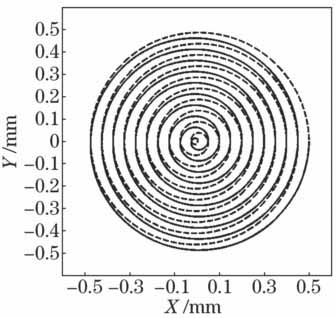
Fig. 2. Schematic diagram of laser helical scanning path
Fig. 3. Self-designed fixture system
Fig. 4. Aperture after the steel sheet is spliced and laser focus location
Fig. 5. Schematic of the plasma shielding phenomenon
Fig. 6. Hole evolution process with the focus down rate of 0
Fig. 7. Time-dependent change of microhole depth at different focus down rates
Fig. 8. Comparison of the ablation depth curve of the focus with and without moving down at a high speed
Fig. 9. Comparison of the ablation depth curve of the focus moving down at three different medium rates
Fig. 10. SEM images of the machined holes in different focus down rates with the processing time of 100 s. Focus down rates: (a) 0; (b) 0.005 mm/s; (c) 0.010 mm/s; (d) 0.015 mm/s; (e) 0.020 mm/s
Fig. 11. Transmission characteristics and light intensity distribution of the Gaussian beam
Parameter | Range |
---|
Pulse width /fs | 250 | Wavelength /nm | 1064 | Repetition rate /kHz | 60-600 | Average power /W | 0-15 | Rotation rate /(r·min-1) | 600-2400 | Air-blowing pressure /MPa | 0-0.5 | Spot radius /μm | 15-25 |
|
Table 1. Related parameters of laser and machine
Factor | Processparameter | Level1 | Level2 | Level3 | Level4 | Level5 |
---|
A | Single pulseenergy /μJ | 20 | 22 | 24 | 26 | 28 | B | Repetitionrate /kHz | 100 | 200 | 300 | 400 | 500 | C | Air-blowingpressure /MPa | 0.1 | 0.2 | 0.3 | 0.4 | 0.5 | D | Rotation rate /(r·min-1) | 600 | 1050 | 1500 | 1950 | 2400 | E | Rate of focusdown /(mm·s-1) | 0 | 0.005 | 0.01 | 0.015 | 0.02 |
|
Table 2. Factors and levels of orthogonal experiment
Rate of focusdown /(mm·s-1) | Drilling time /s | | | | | | | | | | | | | | |
---|
| | | | | | | | | | | | | | Hole1 | Hole2 | Hole3 | Hole4 | Hole5 | Hole6 | Hole7 | Hole8 | Hole9 | Hole10 | Hole11 | Hole12 | Hole13 | Hole14 | Hole15 |
---|
0 | 1 | 2 | 3 | 6 | 10 | 15 | 20 | 30 | 40 | 50 | 60 | 70 | 80 | 90 | 100 | 0.005 | 1 | 2 | 3 | 6 | 10 | 15 | 20 | 30 | 40 | 50 | 60 | 70 | 80 | 90 | 100 | 0.010 | 1 | 2 | 3 | 6 | 10 | 15 | 20 | 30 | 40 | 50 | 60 | 70 | 80 | 90 | 100 | 0.015 | 1 | 2 | 3 | 6 | 10 | 15 | 20 | 30 | 40 | 50 | 60 | 70 | 80 | 90 | 100 | 0.020 | 1 | 2 | 3 | 6 | 10 | 15 | 20 | 30 | 40 | 50 | 60 | 70 | 80 | 90 | 100 |
|
Table 3. Schedule of focus down test
Level | Column number/Factor | | | | | |
---|
| 1/A | 2/B | 3/C | 4/D | 5/E | 6/None |
---|
| 207.056 | 195.378 | 204.742 | 206.422 | 230.002 | 226.208 | | 197.594 | 204.326 | 205.804 | 222.628 | 225.840 | 223.050 | | 225.480 | 207.150 | 225.068 | 212.850 | 222.076 | 224.577 | | 236.082 | 236.838 | 233.638 | 234.718 | 215.496 | 209.452 | | 241.576 | 264.096 | 238.536 | 231.170 | 214.374 | 224.196 | | 43.982 | 68.718 | 33.794 | 28.296 | 15.628 | 16.756 |
|
Table 4. Range analysis of orthogonal experimental data
Source of variation | Sum of squares | Freedom | Variance | F-value | Critical valueof F-test | Significance |
---|
Single pulse energy | 7058.151 | 4 | 1764.538 | 7.515 | | * | Repetition rate | 16164.423 | 4 | 4041.106 | 17.210 | | ** | Air-blowing pressure | 4887.327 | 4 | 1221.832 | 5.203 | F0.05,(4,4)=6.39 | | Rotation rate | 2858.244 | 4 | 714.561 | 3.043 | F0.01,(4,4)=15.98 | | Rate offocus down | 891.313 | 4 | 222.828 | 0.949 | | | Error | 939.260 | 4 | 234.815 | | | | Total | 32798.718 | 24 | 1366.613 | | | |
|
Table 5. Variance analysis of orthogonal experimental data
Serialnumber | Singlepulseenergy /μJ | Repetitionrate /kHz | Air-blowingpressure /MPa | Rotationrate /(r·min-1) | Rate offocus down /(mm·s-1) | Ablation depth /μm | Relativeerror /% |
---|
| Experimentalvalue | Simulationvalue |
---|
1 | 20 | 500 | 0.3 | 1050 | 0.010 | 240.91 | 235.48 | -2.25 | 2 | 22 | 400 | 0.2 | 2400 | 0.015 | 278.19 | 276.51 | -0.61 | 3 | 24 | 500 | 0.1 | 2400 | 0.020 | 248.38 | 250.22 | 0.74 | 4 | 26 | 400 | 0.3 | 1050 | 0.015 | 248.64 | 245.32 | -1.34 | 5 | 28 | 200 | 0.4 | 600 | 0.010 | 182.18 | 184.35 | 1.19 |
|
Table 6. Verification experimental data and network simulation results